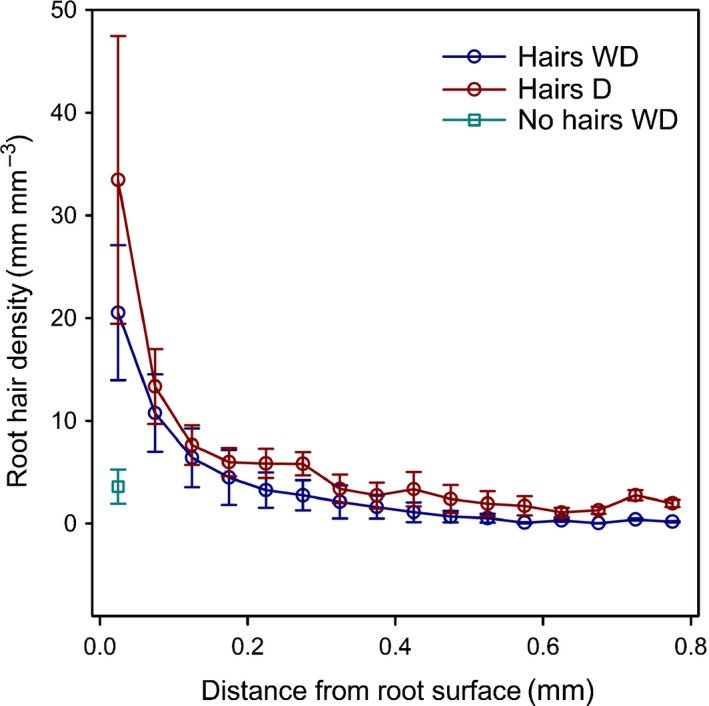
Figure 4.

Mean root hair density of barley roots over distance from the root surface. Each value represents mean root hair density within an annulus of thickness 0.05 mm about the root centre. The x values represent the inner diameter + 0.025 mm of each annulus. Error bars represent ± SE of the mean. The no hairs genotype only had short hairs in the innermost annulus. WD, wet–dry treatment; D, dry treatment.
