Figure 5.

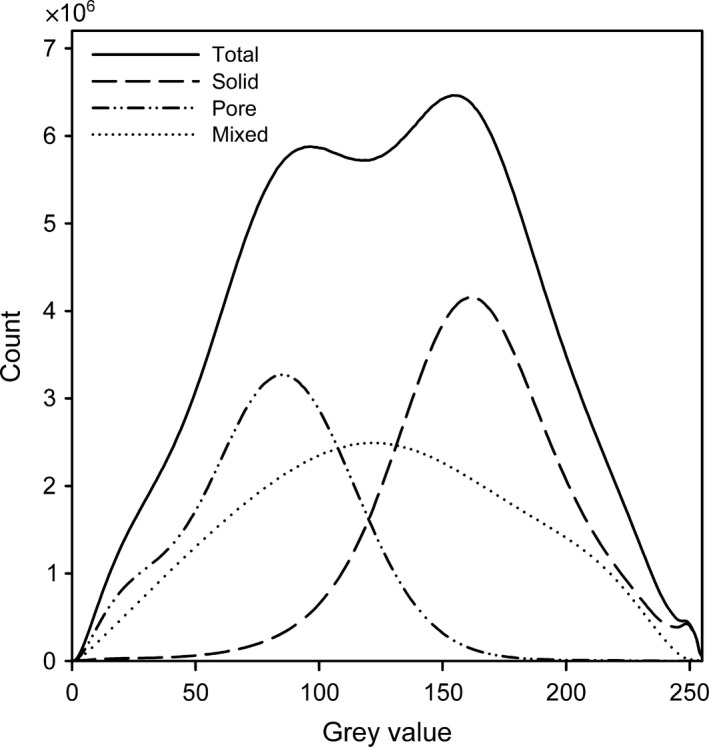
Grey value histograms of the total 3D region of interest in the barley rhizosphere and the different segmented phases showing overlapping grey values of the different phases, particularly the mixed phase.

Grey value histograms of the total 3D region of interest in the barley rhizosphere and the different segmented phases showing overlapping grey values of the different phases, particularly the mixed phase.