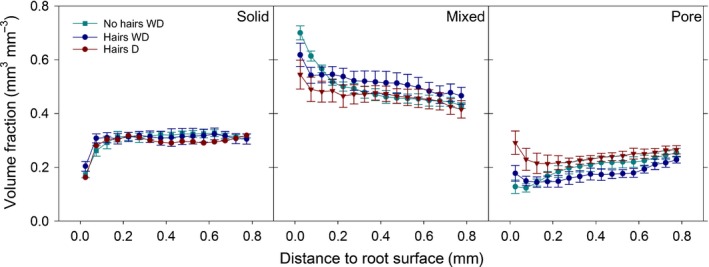
Figure 6.

Volume fractions of solid, mixed and pore phase, respectively, over distance from barley root surface. Data are mean volume fractions within an annulus of 0.05 mm diameter; x‐values are annulus inner diameter + 0.025 mm. Error bars represent ± SE of the mean. WD, wet–dry treatment; D, dry treatment.
