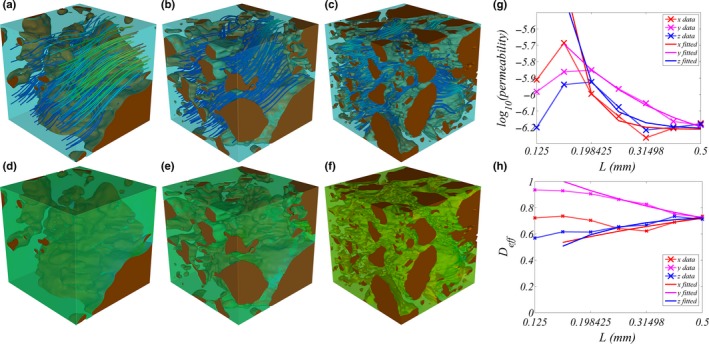
Figure 8.

Image‐based modelling of relative permeability k and effective diffusion constant D eff in the barley rhizosphere. (a–f) Simulation results for selected test volumes of increasing side length (left: 0.16 mm; middle: 0.25 mm; right: 0.4 mm) taken from a sample of hairs WD. Note that the smaller test volumes are subsets of the larger ones. (a–c) Flow streamlines show local Darcy velocities. Warmer colours indicate greater relative velocity. (d–f) Colours show relative impedance to diffusion. (g, h) The convergence of (g) k and (h) D eff in the x, y and z directions with increasing test volume size. Dashed lines show simulated values and solid lines the exponential fit.
