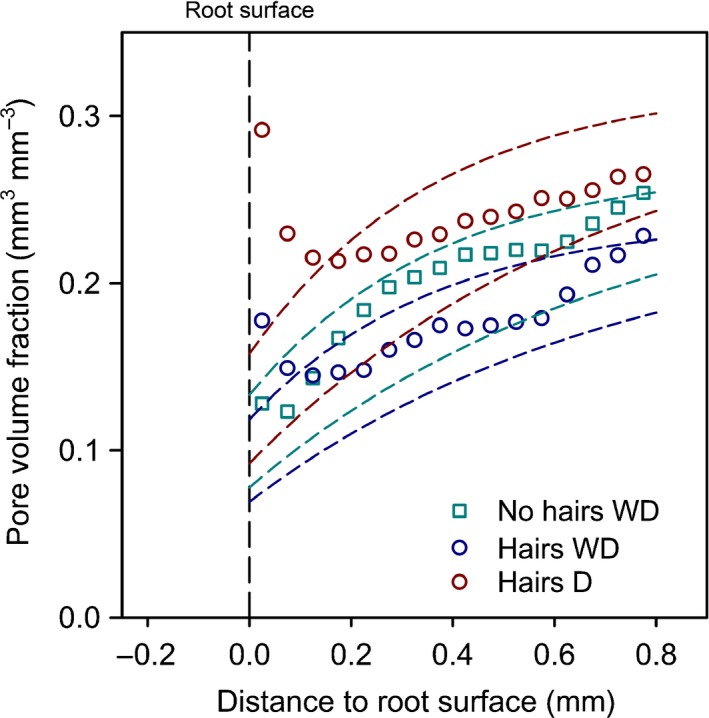
Figure 9.

Predicted pore volume fraction over distance from the barley root using the model of Dexter (1987). Dashed lines show the predicted pore volume fraction for each sample. Mean pore volume fraction at 1 mm distance was used as the bulk porosity for each treatment. Upper and lower dashed lines of matching colours show the predicted pore volume fraction using soil mechanical parameters kD = 0.68 and 0.34, respectively. Data points show mean pore volume fractions obtained from image analysis. WD, wet–dry treatment; D, dry treatment.
