
Figure 4.
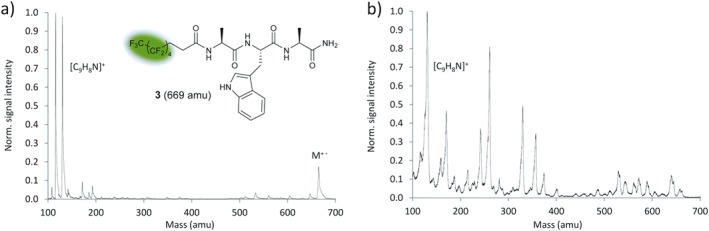
VUV‐TOF versus EI‐QMS. (a) VUV‐TOF mass spectrum of a thermal perfluoroalkyl functionalized peptide beam (3), recorded at T = 548 K. A strong parent peak (m = 669 amu) is observed and accompanied by the indole cation (C8H6N+, 116 amu) and skatole cation (C9H8N+, 130 amu). The spectrum was calibrated to the indole cation (C8H6N+, 116 amu). (b) In contrast, the EI‐QMS spectrum at 70‐eV electron energy yields a pronounced fragment spectrum under otherwise identical boundary conditions. The spectrum was calibrated to the skatole cation (C9H8N+, 130 amu). The green highlight indicates the fluoroalkyl‐tag. [Colour figure can be viewed at wileyonlinelibrary.com]