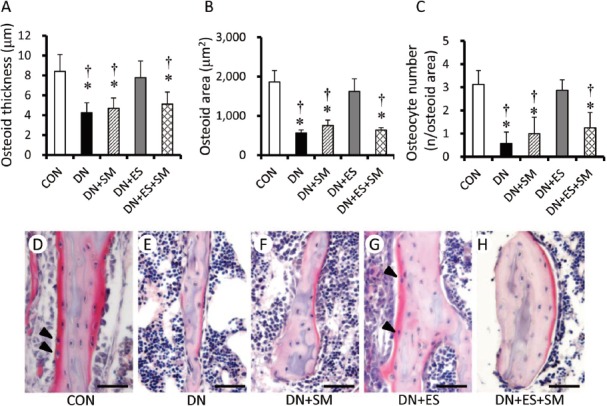
Figure 4.

Histomorphometric analyses for mean osteoid thickness (A), osteoid area (B), and osteocyte numbers embedded in the osteoid area (C), and a representative image of osteoid (D-H) following DN of 1 week. Micrographs show distinct eosinophilia of the osteoid matrix at trabecular bone stained with H-E and osteocytes embedded in osteoid (arrowhead in D and G). Bar = 50 μm *P< 0.05, vs CON, †P<0.05, vs ES. Values are means ± SD.
