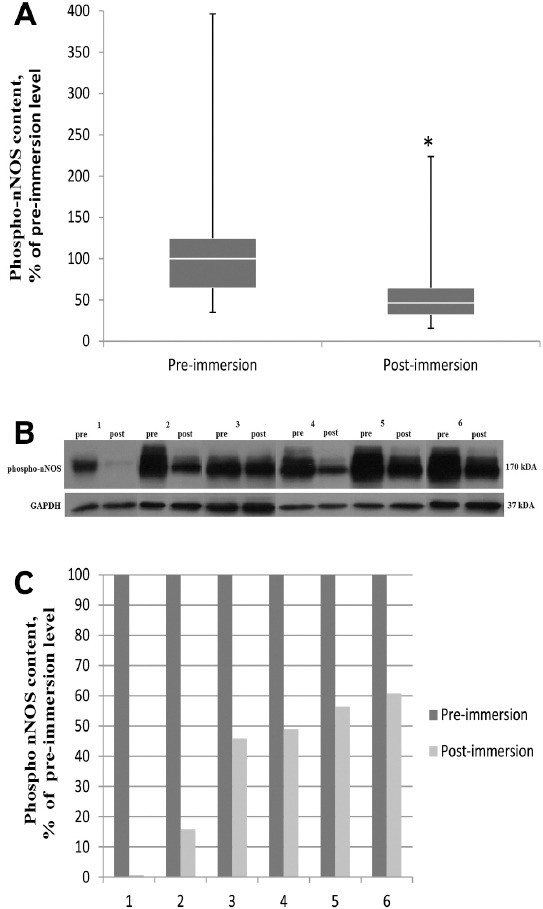
Figure 4.

Effect of 3 day dry immersion on phospho-NOS content in human soleus muscle. A. General phospho-NOS (Ser1417) content in soleus muscle before and after 3 day dry immersion (n=6), normalized to GAPDH. Box plots show 25-75 percentiles and median values and the whiskers represent the minimum and the maximum, * - difference from the pre-immersion level (p<0.05). B. Representative immunoblots of phospho-NOS(Ser1417) and GAPDH content in soleus muscle of each individual (n=6) before and after 3 day dry immersion. C. Quantification of phospho-NOS (Ser1417) content of each individual before (pre) and after (post) 3 day dry immersion, normalized to GAPDH.
