
Figure 7.
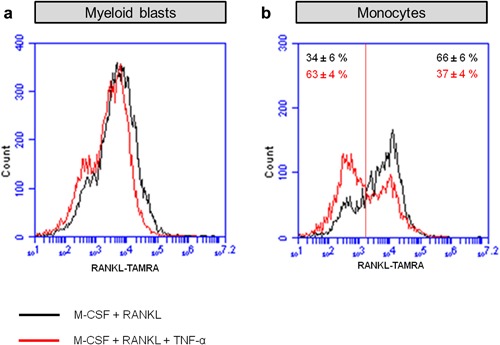
FACS analysis showed a different distribution of RANKL expression induced by TNF‐α in monocytes. (a) Binding of TAMRA‐labeled‐RANKL to myeloid blasts. (b) Binding of TAMRA‐labeled‐RANKL to monocytes. Black line: cells were cultured for 72 hr in the presence of 30 ng/ml M‐CSF and 20 ng/ml RANKL (control); red line: cells were cultured for 72 hr in the presence of 30 ng/ml M‐CSF, 20 ng/ml RANKL, and 10 ng/ml TNF‐α