Supplementary Figure S2.

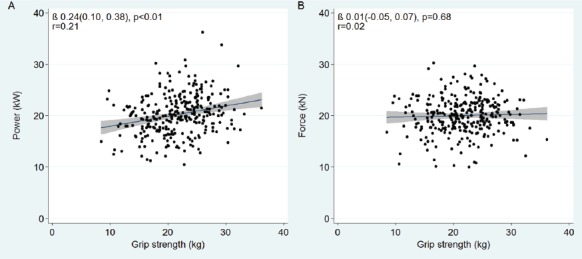
Scatter plots with linear regression lines with 95% confidence intervals, and correlation coefficients shown to illustrate the relationships between muscle power (A) and force (B), with grip strength.

Scatter plots with linear regression lines with 95% confidence intervals, and correlation coefficients shown to illustrate the relationships between muscle power (A) and force (B), with grip strength.