

Abstract
The activation strain or distortion/interaction model is a tool to analyze activation barriers that determine reaction rates. For bimolecular reactions, the activation energies are the sum of the energies to distort the reactants into geometries they have in transition states plus the interaction energies between the two distorted molecules. The energy required to distort the molecules is called the activation strain or distortion energy. This energy is the principal contributor to the activation barrier. The transition state occurs when this activation strain is overcome by the stabilizing interaction energy. Following the changes in these energies along the reaction coordinate gives insights into the factors controlling reactivity. This model has been applied to reactions of all types in both organic and inorganic chemistry, including substitutions and eliminations, cycloadditions, and several types of organometallic reactions.
Keywords: chemical reactivity, computational chemistry, quantum chemistry, reaction mechanisms, transition states
Understanding chemical bonding and reactivity has been the principal goal of theoretical chemistry since the inception of quantum mechanics, nearly one century ago. Roald Hoffmann, our mentor and inspiration, has done more than anyone to understand the factors controlling reactivity on the basis of molecular orbitals. Our groups have independently developed a model: called the distortion/interaction model or the activation strain model by the two groups. This Review introduces the model and describes its applications in many areas of chemistry.
1. Reactivity Models and Computational Modeling
Since the pioneering studies by Eyring and Polanyi, many theoretical models of reactivity have been developed. The most prominent models in organic chemistry include the frontier molecular orbital (FMO) theory,1, 2 Marcus theory,3 and the curve‐crossing model in valence bond (VB) theory.4 The frontier molecular orbital theory of Fukui et al.5a and the Woodward–Hoffmann theory spread quantum mechanical models to a wide range of organic experimentalists, who previously had relied on very useful empirical models.
In the model that is perhaps most clearly related to ours—Marcus theory—activation barriers are expressed in terms of the intrinsic reactivity of a thermoneutral reference reaction system and the influence of the thermodynamics of the reaction [see Eq. (1)].3 This model has been enormously successful, but the model does not answer the question of why a particular thermoneutral reference system has the intrinsic reactivity or barrier height it has. This intrinsic barrier is described in terms of reorganization energy in solution upon vertical electron transfer, but Marcus theory has been applied more generally.
| (1) |
In the VB curve‐crossing model, trends in barrier height are described in terms of the relative energies of, and resonance between, the reactant and product states, again in the overall reaction system, either on the side of the reactants [A,B] or the product [C; see Eq. (1)].4 The VB curve‐crossing model traces the energy of the reactant and product states, as well as the resonance between them, directly to the electronic structure. This has the advantage that the model can answer questions, such as why states are close or far apart in energy (i.e. why there is a low or a high energy barrier) and in which situation substantial resonance stabilization of the transition state (TS) can be expected. The VB curve‐crossing model differs from our model in that it approaches reactivity from the overall reaction system (in the reactant, TS, and product state), but it is very closely related in spirit. In particular, it aims at establishing a causal relationship between the electronic structure of the reacting species and the height of the reaction barrier. The VB curve‐crossing model has developed into a major player in reactivity theory, with numerous applications in organic, organometallic, and inorganic chemistry.4d–4k Shaik, Schwarz, and co‐workers,4i–4k for example, elegantly showed how the VB curve‐crossing model can go hand‐in‐hand with our model to explain the occurrence of, and trend in, activation strain and TS interaction terms of hydrogen atom transfer reactions.
We have developed a different approach, one that expresses and explains chemical reactivity in terms of the reactants and their energies of distortion and changes in the electronic energy required to achieve the transition state.6, 7 Hoffmann, as well as Fukui and co‐workers before him,5 used frontier molecular orbital (FMO) theory to approximate the interaction between molecules, but usually neglected the distortion that also occurs upon reaction.
Our model constitutes a significant extension of the original FMO model and the role played therein by symmetry and orbital interactions.6, 7 Our model, unlike FMO theory, also covers all the chemical reactions that escape the symmetry principles.8 There are many symmetry‐allowed reactions that do not proceed readily. The vast majority of conceivable chemical reactions are symmetry‐allowed, and yet only some of them are viable. The reason for such discrepancies between the original FMO model and experiment is not due to deviations in the actual reaction mechanism from the assumed synchronous, highly symmetric pathways. In fact, asynchronous modes of transformation are generally more stable than enforced symmetric paths.9 Furthermore, such discrepancies are in most cases not caused by subtle features in the bonding mechanism that become apparent only if one uses more quantitative computational methods.10
There is another important factor that is missing all together: distortion energies, namely, the energy penalty associated with the deformations of the reactants as the reaction progresses. The relative energy of a bimolecular TS of A and B, for example, is not only determined by how the reactants A and B mutually interact, but also by how energetically strained the deformed reactants A* and B* are [see Eq. (2)]. Just as the capability to mutually interact depends on the shapes and electronic structures of the reactants, so do the distortions that build up during the reaction. Note that a consistent description can be achieved of the TS and the reaction barrier, as well as of the entire reaction profile from the initial stage of the reaction to the product, in which the reactants are heavily distorted compared to their original structure [see A** and B** in Eq. (2)].
| (2) |
Our model of chemical reactivity reveals the physical factors that control the height of the activation barriers and reactivity trends upon changing the structure and substituents of the reactants. In this Review, we provide a detailed description of our model, its concepts, and quantities, as well as instructions on how to compute them. Thereafter, the concepts are brought to life in a variety of applications throughout organic and inorganic chemistry.
2. The Activation Strain‐Distortion/Interaction Model
The activation strain model6 or distortion/interaction model7 is a systematic development of an energy decomposition, which was already used for stable molecules in a quantitative analysis scheme by Morokuma as well as Ziegler and Rauk.11 Equilibrium structures, transition states (TS), and nonstationary points along a reaction coordinate can be analyzed. In our model, the potential energy surface ΔE(ζ) is decomposed into two contributions along the reaction coordinate ζ: the reaction strain or distortion energy ΔE strain(ζ), which is associated with the structural distortion that the reactants undergo during the reaction, plus the interaction ΔE int(ζ) between these increasingly distorted reactants [see Eq. (3) and Figure 1]:
| (3) |
Figure 1.
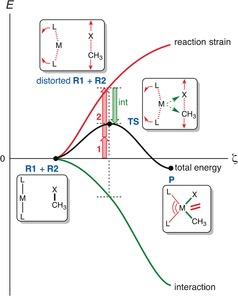
The activation‐strain model exemplified using a metal‐mediated C−X bond activation: [reactant 1]+ [reactant 2]+ .
The reaction strain ΔE strain(ζ) is determined by the rigidity of the reactants, for example, the strength of bonds that must break or the flexibility of bond angles that get deformed. However, the reaction strain also depends on the type of reaction mechanism. This determines how many bonds are breaking and to what extent groups must reorganize. For example, as we will see later on, nucleophilic displacement goes naturally with less distortion than does the competing E2 elimination. Therefore, the extent of distortion and thus the strain energy are characteristic for the reaction pathway under consideration. In general, ΔE strain(ζ) is positive, that is, destabilizing, and thus a factor that gives rise to the activation barrier. This term can be further partitioned into the individual contributions (red 1 and 2 in Figure 1) stemming from each of the reactants involved in the process.
The interaction energy ΔE int(ζ) between the reactants depends on their electronic structure and on how they are mutually oriented as they approach each other. Thus, the latter term is related to the bonding capabilities and mutual interaction between the increasingly deformed reactants along the same pathway. The bonding mechanism behind the interaction ΔE int(ζ) can be further analyzed in the conceptual framework provided by the Kohn–Sham molecular orbital model using the so‐called energy decomposition analysis (EDA).10, 11 The EDA quantifies the electrostatic attraction, Pauli‐repulsive orbital interactions between same‐spin electrons, and stabilizing orbital interactions, such as, the HOMO–LUMO interactions, which are the basis of Fukui's frontier molecular orbital theory. Note that the EDA is exact in the sense that it does not introduce any further approximation to the computations (e.g. ZORA‐OLYP/TZ2P):10 its components together exactly yield the interaction energy computed at the quantum chemical level of theory used in the computations, both for weak and strong chemical bonds.10 In most cases, ΔE int(ζ) is negative, that is, stabilizing and, therefore, a factor that counteracts the strain term ΔE strain(ζ) and causes the eventual height of the reaction barrier to become lower than if strain were the only factor. There are exceptions to this rule, such as in some cycloadditions which feature positive, repulsive, interaction terms in early stages of the reaction.
It is the interplay between ΔE strain(ζ) and ΔE int(ζ) that determines where the barrier arises. The reaction profile reaches its maximum in the TS according to Equation (4).
| (4) |
The reaction coordinate ζ is usually obtained as the intrinsic reaction coordinate (IRC) from a steepest‐descent calculation.12 This reaction coordinate may then be projected onto a critical geometrical parameter,13 such as the C−X bond that is broken in an oxidative addition reaction (Figure 1). The critical geometry parameter ζ is always defined at the x‐axis of the diagram showing ΔE(ζ), ΔE strain(ζ), and ΔE int(ζ) as a function of the progress of the reaction ζ, the so‐called activation strain diagram (ASD).
According to our model, the activation energy of a reaction ΔE ≠=ΔE(ζ TS) consists of the activation strain (or distortion energy) and the TS interaction (Figure 1). The distortion energy, or activation strain, is defined as the energy required to distort the reactants from their equilibrium geometries to the geometries in the TS. The interaction energy involves interaction between the deformed reactants at the TS: . This give Equation (5).
| (5) |
The values of and at the TS must be interpreted with great care. This is because the optimized TS structure is the result of a balance between the distortion or strain energy ΔE strain(ζ) and the interaction energy ΔE int(ζ). This highlights the importance of taking into account the behavior of the two components along the reaction coordinate, especially their slopes. A single‐point analysis at the TS, only, can yield misleading values! Analyses along the entire reaction coordinate are the best way to reveal the true origin of the activation energy.
This is illustrated by the bimolecular nucleophilic substitution (SN2) reactions. Figure 2 shows idealized activation strain diagrams (ASD) for archetypal gas‐phase SN2 reactions. For numerical examples in real systems, we refer to the diagrams of SN2 reactions of halides with methyl halides computed with ZORA‐OLYP/TZ2P.14 The black curves in Figures 2 a and 2 b represent the ASD of a reference system featuring a moderate nucleophile X− and a moderate leaving group Y. The green curves in Figure 2 a show that a better nucleophile lowers the SN2 barrier by enhancing the stabilizing interaction at any point along the reaction coordinate. This originates from a stronger gas‐phase Lewis basicity of the better nucleophile. On the other hand, the red curves in Figure 2 b show that a poorer leaving group raises the SN2 barrier because of a more destabilizing strain curve. Lengthening a stronger C−Y bond carries a higher energy penalty. This is gratifyingly in line with an early VB curve‐crossing analysis of SN2 reactions by Mitchel, Schlegel, Shaik, and Wolfe.4d
Figure 2.
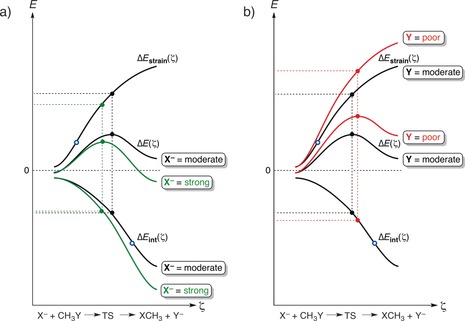
Activation strain or distortion/interaction diagram for SN2 reactions, showing the position of transition states (filled dots) and inflection points of the reaction‐strain and interaction curves (blue circles). In (a) and (b), the black curves denote the same reference reaction system with a moderate nucleophile X− and a moderate leaving group Y. In (a), the green curves show the effect of using a better nucleophile but keeping the moderate leaving group. In (b), the red curves show the effect of using a poorer leaving group Y but keeping the moderate nucleophile.
Note that a single‐point analysis at the respective transition states may erroneously suggest that the lower SN2 barrier in the case of a better nucleophile is caused by a lower strain associated with distortion of the substrate (Figure 2 a). Inspection of the full ASD, however, clearly shows that at any point along the reaction coordinate ζ, the reaction strain is the same for both reactions. In both reactions, it stems from elongating and breaking the same C−Y bond in the same methyl halide substrate. As already mentioned above, it is the more stabilizing interaction curve ΔE int(ζ) that causes the lower‐energy reaction profile ΔE(ζ) and the lower barrier in the case of the better nucleophile. The reason why the single‐point analyses suggest the opposite picture is that the weaker interaction in the case of the poor nucleophile shifts the TS for the SN2 reaction to a later stage along the reaction path. This is because the weaker interaction curve is also shallower. Thus, according to Equation (4), the interaction curve ΔE int(ζ) achieves balance with the unmodified strain curve at a later stage, at which ΔE strain(ζ) levels off and also becomes more shallow.
Our model also reveals the physical mechanism behind the linear free energy relationships between activation energies and reaction energies,15 as well as the origins of the Hammond postulate.16 A less‐stabilizing interaction curve both raises the reaction barrier and makes the reaction more endothermic. However, as pointed out above, a less‐stabilizing interaction curve also shifts the TS to the right, that is, to a more product‐like stage of the reaction. In other words, the Hammond postulate is a really well‐understood principle. Deviations from the Hammond postulate can also be understood. They are the result of irregular patterns that may arise in the shape of the strain or interaction curves as a result of particular steric or electronic conditions.
3. Protocol for a Reactivity Analysis
Before turning to the applications, we describe how the analysis is carried out in practice. The procedure consists of the following three steps:
First, one has to find the relevant stationary points (reactants, TS, products) and the intrinsic reaction coordinate (IRC) associated with the elementary reaction step of interest. This can be either from the reactants via the TS to products. Or, if they exist, the IRC runs from a weakly bound reactant complex via the TS to the products or, again, a weakly bound product complex. Note that, in the latter case, the reaction profile starts at a point at which the total energy ΔE(ζ) is already slightly below that of the original reactants, and the distortion (or strain) curve ΔE strain(ζ) and the interaction curve ΔE int(ζ) have already slightly positive and negative values, respectively. At that point, the reaction may already have also made a modest start in proceeding along its critical geometry parameters, such as, bond breaking. A case in point is the activation strain diagram (ASD) for the SN2 reactions in Figure 2.
Second, a physically meaningful projection of the IRC should be done.13 Here, there is some freedom of choice, and often this is not so much a choice between right or wrong but between useful and not so useful. The IRC is a complex combination of geometry parameters, which complicates its interpretation. The movement of floppy groups that are not critically related to the geometry parameters that characterize the reaction, that is, the actual bond breaking and making, can still have significant, and thus disturbing, effects on the value and rate of change of the IRC. To have well‐defined initial and final values and to ensure a consistent comparison along a series of analogous reactions, it is therefore useful, if not crucial, to project the IRC on such a critical geometry parameter. Thus, energies and energy components at the various points along the IRC, for example, ΔE(ζ), ΔE strain(ζ), and ΔE int(ζ), are then plotted as a function of the value that the critical geometry parameter ζ adopts at each of the IRC points. A concrete example is metal‐mediated C−X bond activation through oxidative addition: here an excellent choice is to project the IRC onto the stretch of the C−X bond relative to its equilibrium bond distance in the isolated substrate.13
Third, and finally, the evaluation of the reaction strain ΔE strain(ζ) and interaction ΔE int(ζ) is simply achieved by two extra single‐point computations per IRC step, namely, one for each of the two individual reactants in the geometry they adopt at that IRC point.
4. Applications in Chemistry
4.1. E2 and SN2 Reactions
Bimolecular base‐induced elimination [E2, Eq. (6a)a)] and nucleophilic substitution [SN2, Eq. (6b)b)] are two archetypal organic reactions that are standard tools in organic synthesis.8a
| (6a) |
| (6b) |
In a reaction system consisting of a base X− and a substrate containing a leaving group Y and a β‐proton, E2 elimination always competes with SN2 substitution. To control the outcome of a reaction, one reaction must become faster relative to the other. This can be achieved by either accelerating one more or by decelerating it less than the other. In the following, we illustrate this with a generic example for E2 and SN2 reactions, in which all the essential insights from a series of modern DFT studies have been combined.6a, 14, 17, 18 We have verified that E2 versus SN2 trends found at BP86/TZ2P//Xα/DZP, used in Refs. 18a,18b, are recovered at the state‐of‐the‐art ZORA‐OLYP/TZ2P//ZORA‐OLYP/TZ2P level of theory.18d
SN2 reactions can be accelerated either by enhancing the stabilizing interaction ΔE int(ζ) or by reducing the energy for distortion to the transition state ΔE strain(ζ). The key function controlling ΔE int(ζ) is the orbital interaction between the nucleophile (base) HOMO (e.g. the n p AO of a halide) and the substrate σ*C−Y LUMO.14 Thus, by raising in energy the HOMO of the nucleophile (e.g. from X−=Cl− to X−=F−),19 one can reinforce the interaction curve and accelerate the SN2 reaction (Figure 2 a: from the black to the green curves). In other words, a stronger Lewis base is a better nucleophile. The SN2 reaction can also be accelerated if one uses a leaving group Y that yields a weaker C−Y bond in the substrate (e.g. from C−F to C−Cl),20 because this translates into less reaction strain (distortion energy; Figure 2 b: from the red to the black curves). There are countless other ways in which reaction strain and interaction in SN2 reactions can be tuned.17
With a substrate bearing both a Y leaving group at Cα and a proton at Cβ [Eq. (6)], there is the possibility for competition between protophilic attack at Hβ, leading to E2 elimination [Eq. (6a)], and nucleophilic attack at Cα, leading to the SN2 substitution [Eq. (6b)]. The two pathways have very different and characteristic values of distortion energy (activation strain), as shown in Figure 3 a. Here, we focus the analysis on the TS of four reactions: the E2 and the SN2 reactions of a strong and of a weak base X− with identical substrates CH3CH2Y.18
Figure 3.
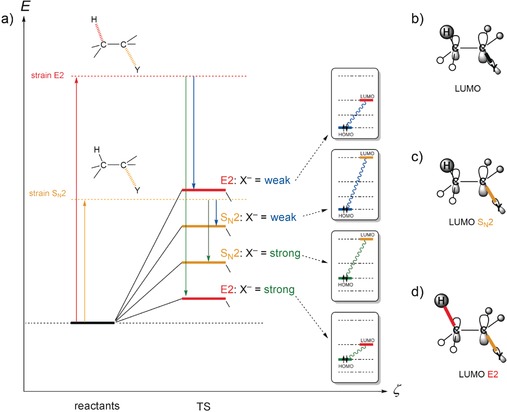
a) Schematic activation strain diagram for the four transition states (TS) of the E2 and SN2 reactions of a weak and a strong base X− (i.e. low‐ and high‐energy HOMO) with identical substrates CH3CH2Y, showing for each TS the base–substrate HOMO–LUMO gap. b) The substrate LUMO is Cα−Y and antibonding Cβ−H. c) SN2 distortion reduces the antibonding Cα−Y overlap and thus lowers the LUMO energy. d) E2 distortion lowers the substrate LUMO even more because both Cα−Y and Cβ−H antibonding overlap are reduced.
E2 elimination has a higher degree of distortion because two bonds are broken (Cα−Y and Cβ−H). It is, therefore, associated with a relatively high activation strain, no matter which base X− is used (Figure 3 a). SN2 substitution, on the other hand, is characterized by less distortion and a lower activation strain because only one bond is broken (Cα−Y). At the same time, the different degrees of distortion for the E2 and SN2 pathways also have a major effect on the electronic structure of the substrate along the reaction and, in particular, the transition state. The substrate LUMO has σ* antibonding character with regards to the Cα−Y and Cβ−H bonds (Figure 3 b).18 Consequently, the SN2 distortion reduces the antibonding overlap for Cα−Y and thus lowers the energy of the LUMO (Figure 3 c). Note, however, that E2 distortion lowers the substrate LUMO even more, because the antibonding overlap of both Cα−Y and Cβ−H are reduced (Figure 3 d). This implies a smaller HOMO–LUMO gap with any base or nucleophile and, thus, that the TS interaction between the base and substrate is significantly more stabilizing in the E2 than in the SN2 transition state. In other words, the E2 distorted substrate is a stronger Lewis acid than the SN2 distorted one.
These insights rationalize many experimental observations8a, 21 and they provide design principles. Thus, if X− is a strong Lewis base, that is, has a high‐energy HOMO, it can compensate for the high E2 activation strain because the smaller HOMO–LUMO gap generates a more stabilizing base–substrate interaction that lowers the energy of the E2 transition state below that of the SN2 reaction. However, if X− is a weak Lewis base, that is, if it has a low‐energy HOMO, it can no longer compensate for the high E2 activation strain, despite the fact that the TS interaction is still stronger for the E2 than the SN2 transition state. The reason is that, at some point, when the HOMO–LUMO gap grows too large, the TS interaction becomes too weak to change the trend that is set by the activation strain, which is in favor of the less‐distorted SN2 pathway.
Thus, we explain why strong bases react through protophilic attack, whereas weak bases behave as nucleophiles and react through nucleophilic attack: the smaller HOMO–LUMO gap generates a more stabilizing base–substrate interaction that lowers the energy of the E2 transition state below that of the SN2 reaction. The same mechanism also explains why (stronger) solvation causes a shift from protophilic to nucleophilic reactivity: solvation makes X− a weaker base, primarily by stabilizing its HOMO.18b This is why the same, or similar, reactants more frequently show E2 reactivity in the gas phase while in solution they have an enhanced inclination to react through SN2 substitution.
4.2. Nucleophilic Additions to Alkenes and Alkynes
Some years ago, we explained the greater reactivity of electron‐deficient alkynes compared to alkenes in nucleophilic reactions. Whereas frontier MO energies of alkenes and alkynes would indicate greater reactivities of alkenes because of the lower LUMO energies of alkenes, the alkyne is actually more reactive. It is the easy distortion of the alkyne and the narrowing of the HOMO–LUMO gap that makes the alkyne more reactive towards nucleophiles. In the transition states, acetylene has a lower energy LUMO.22a Around the same time, we described the role of distortion on the addition of both benzynes and radicals to alkenes.22b,22c The first application of this model to explain the stereoselectivity of additions to carbonyl compounds was reported soon thereafter.22d
4.3. Diels–Alder Cycloadditions: Strain‐Promoted versus Distortion‐Accelerated reactions
The distortion/interaction model has been especially fruitful for explaining cycloaddition reactivity. We showed how the Diels–Alder cycloaddition reactivity of a large variety of aromatic hydrocarbons and heterocycles with ethylene and the reactions of those same hydrocarbons with H2 both correlate very closely with the distortion energies of the reaction.23 Figure 4 shows the correlations with distortion energies (a) and the energies of reaction (b).
Figure 4.
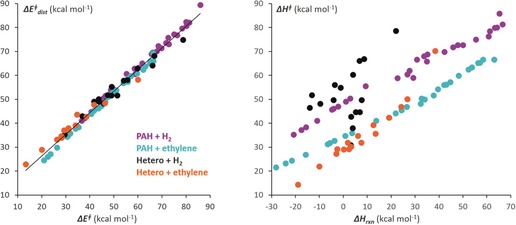
Correlation between the computed activation energies of Diels–Alder reactions of aromatic dienes with maleic anhydride and the distortion energies (left) and energies of the reaction (right).
The latter correlation is an example of an empirical correlation going back to Dimroth, rationalized by Evans and Polanyi and by Hammond, Jencks, and others,15 and given theoretical underpinning in Marcus theory.24
There are some cases where the activation energy correlates with the reaction energies (the Evans–Polanyi situation) and also correlate with distortion energies. This occurs when the distortion energy of the transition state, or activation strain, is just a fixed fraction of the distortion in the products. This is not always the case. Recent applications of the distortion/interaction model show excellent correlations between the distortion energies of the transition states and activation energies, but the energies of the reactions do not correlate well with the activation energies.25 In collaboration with Danishefsky's experimental group, our group (Paton et al.25a) studied the Diels–Alder reactions of cyclopentadiene with cycloalkenones such as cyclohexenone, cyclopropenone, as well as the acyclic pent‐3‐ene‐2‐one. The transition states for the reactions are shown in Figure 5.
Figure 5.
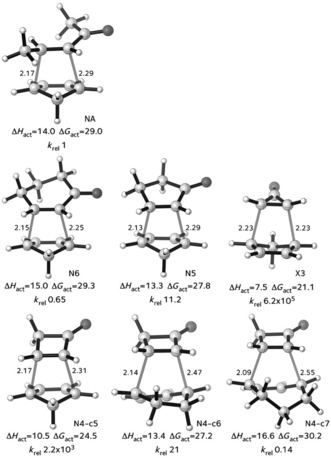
Transition states of Diels–Alder reactions of cyclopentadiene with enones. Computed at the M06‐2X‐6‐31G(d) level. Energies in kcal mol−1.25a.
We also studied the reactions of the corresponding cycloalkenes with a variety of dienes.25b Figure 6 shows a plot of the activation energies of the cycloadditions of cycloalkenes and cycloalkenones with cyclopentadiene versus their distortion energies.
Figure 6.
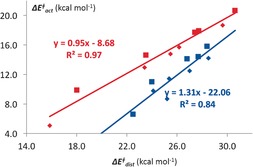
Correlation between the activation energies and distortion energies for Diels–Alder reactions of cyclopentadiene with cycloalkenes (red) and cycloalkenones (blue). Both exo (small symbols) and endo (large symbols) are included.
The correlation results from the strain of the small rings, but is not mainly a consequence of the resulting greater exothermicity of the reaction. The distortion energies of the transition states relate closely to the activation energies,25 and recent investigations by our groups have shown that this correlation is the result of differences in the interaction energies, which shift the position of the transition state considerably and cause distortion energies in the transition state to vary, much in the fashion discussed for SN2 reactions in Figure 2.14 Levandowski and Houk have extended this work to a study of substituted cyclopropenes.26
Other applications of the distortion/interaction analysis to azide cycloadditions with norbornenes27 and an interesting carbonyl‐olefin metathesis reaction discovered by Lambert and co‐workers28 have shown the general applicability of the distortion/interaction model to cycloadditions.
Both of our groups have shown how curved arenes have enhanced reactivities compared to planar polybenzenoid arenes in cycloadditions to fullerenes.29 With the groups of Fernandez and Solà, we studied the reactivity of fullerenes in various reaction mechanisms by using the activation strain model.29a In that way, the origin of the experimentally known regioselectivity for [6,6] over [5,6] bonds in Diels–Alder cycloaddition reactions of C60 with cyclopentadiene, for example, could be traced to the more stabilizing interaction between the reactants along the entire reaction coordinate of the [6,6] pathway. This is a direct consequence of the fact that the three degenerate LUMOs of C60 have the appropriate π*C−C character on their [6,6] but not their [5,6] bonds. We studied Diels–Alder reactions of butadiene, and three 1,3‐dipolar cycloadditions to polyacenes, carbon nanotubes, and fullerenes.29 The activation energies were correlated with the distortion energies for planar, curved, and spherical benzenoid hydrocarbons.
4.4. Dehydro‐Diels–Alder Reactions
There has been renewed interest in so‐called “dehydro” cycloadditions because of recent reports by Hoye et al. on synthetic applications.30 The reaction, originally predicted theoretically and established experimentally by Johnson and co‐workers,31 has now been explored by density functional theory by the goups of Hoye and Houk.32 Our results showed the relationship between the unsaturation of the reactants, the distortion energies, and the activation energies for these reactions. Figure 7 shows the reactions studied and the concerted and stepwise pathways of these reactions.
Figure 7.
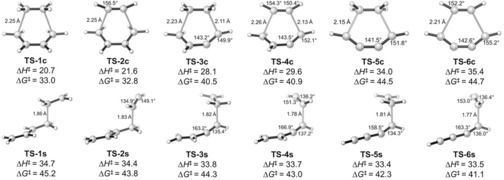
(U)M06‐2X/6‐31+G(d,p)‐optimized transition states for concerted and stepwise parent Diels–Alder reaction and dehydro analogues.
Table 1 shows how the distortion energies of the concerted transition states increase with increasing unsaturation. Table 2 shows the nearly constant distortion energies of the diradical transition states of the stepwise processes. This causes the two mechanisms to be of similar energy for the HDDA reaction. With further substitution, the stepwise mechanism becomes the most favorable.32
Table 1.
Activation, distortion, interaction, and reaction energies (in kcal mol−1) calculated with M06‐2X/6‐311+G(d,p) for concerted reactions.
| Entry | TS | E act | E dist‐4π | E dist‐2π | E dist | E int | E rxn |
|---|---|---|---|---|---|---|---|
| 1 | TS‐1 c | 19.6 | 18.8 | 7.4 | 26.1 | −6.5 | −47.6 |
| 2 | TS‐2 c | 21.2 | 17.1 | 10.3 | 27.4 | −6.2 | −61.8 |
| 3 | TS‐3 c | 27.3 | 24.3 | 10.6 | 34.9 | −7.6 | −18.6 |
| 4 | TS‐4 c | 29.5 | 22.2 | 14.0 | 36.2 | −6.7 | −30.0 |
| 5 | TS‐5 c | 33.9 | 32.8 | 11.4 | 44.3 | −10.4 | −4.4 |
| 6 | TS‐6 c | 36.0 | 29.2 | 14.0 | 43.2 | −7.2 | −57.3 |
Table 2.
Activation, distortion, and interaction energies (in kcal mol−1) calculated with (U)M06‐2X/6‐311+G(d,p) for stepwise reactions.
| Entry | TS | E act | E dist‐4π | E dist‐2π | E dist | E int | E (DR) | E (TSs2) |
|---|---|---|---|---|---|---|---|---|
| 1 | TS‐1 s | 35.4 | 12.6 | 12.2 | 24.9 | 10.5 | 28.5 | 32.1 |
| 2 | TS‐2 s | 35.4 | 10.9 | 16.5 | 27.4 | 8.0 | 27.0 | 29.1 |
| 3 | TS‐3 s | 34.5 | 13.5 | 11.2 | 24.7 | 9.8 | 27.8 | 32.9 |
| 4 | TS‐4 s | 35.0 | 11.9 | 15.1 | 27.0 | 8.0 | 25.0 | 28.3 |
| 5 | TS‐5 s | 34.2 | 14.8 | 11.0 | 25.8 | 8.4 | 29.5 | 37.8 |
| 6 | TS‐6 s | 35.2 | 13.0 | 14.6 | 27.5 | 7.7 | 25.7 | 30.8 |
4.5. Cycloadditions in Bioorthogonal Chemistry
We have applied our model to explain many bioorthogonal cycloadditions and to predict pairs of cycloadditions that are mutually orthogonal.33, 34 Strain‐promoted alkyne–azide cycloaddition (SPAAC) is a popular copper‐free “click reaction” that is used in various areas of chemistry, in particular in bioorthogonal chemistry.33 In a combined experimental and theoretical investigation with the van Delft group, we showed that the rate of fast SPAAC reactions between electron‐poor azides (Ar‐N3) and bicyclononyne (BCN) is dictated by an inverse electron demand (IED) FMO interaction (see Scheme 1).33
Scheme 1.
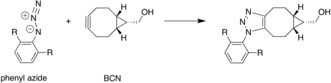
SPAAC reaction of aromatic azides with bicyclononyne (BCN).
Analysis of the activation strain reveals how the interaction in the TS becomes more stabilizing as electron‐withdrawing substituents (R) augment the electron‐poor character of the azide. This causes a lowering of the energy barrier and a concomitant increase in the experimentally observed reaction rate. The reason for this trend lies in an inverse electron demand (IED) FMO interaction between the π‐bonding HOMO and HOMO−1 of BCN and the relatively low energy LUMO of the azide.
A powerful principle that we discovered, and explained in terms of the distortion/interaction model, is the use of intrinsically reactive cycloaddends that are also sterically crowded.34 Steric hindrance often shows up as increased distortion energy. Other cycloaddends may be intrinsically less reactive, but be sterically unhindered. A good example is the high intrinsic electrophilic reactivity of disubstituted tetrazines, as a result of their low‐lying π*‐orbitals; these compounds have relatively high steric requirements because of the two aryl substituents. By contrast, azides are intrinsically less reactive, but much less sterically hindered. The experimental results in Figure 8 illustrate these features.34d
Figure 8.

Examples of mutually orthogonal reactions. Reaction (a) is fast for tetrazines, but not azides. Reaction (b) is fast with azides, but not tetrazines.34d Reaction (c) is faster with tetrazines.
Another example of this type has been applied to the development of new bioorthogonal cycloaddends based on cyclopropene.34e Sterically hindered 3,3‐disubstituted cyclopropenes react with the highly reactive, but small, 1,3‐diaryl nitrileimines, but sterically hindered tetrazines do not react with these cyclopropenes. Tetrazines, in contrast, react readily with 1,3‐disubstituted cyclopropenes.34e These principles have been extended in collaboration with Devaraj in studies on 1,3‐disubstituted cyclopropenes, where general reactions with tetrazines were demonstrated.34f
Computations involving the distortion/interaction model aided experiments that led to new class of bioorthogonal electron‐deficient dienes, the 1,2,4‐triazines. These are much more stable than tetrazines in the cellular milieu, but able to be incorporated into unnatural amino acids and then incorporated into proteins by reaction with trans‐cyclooctenes.34g
4.6. Other pericyclic reactions
In a collaboration with the Fernandez group, we investigated the Alder‐ene reaction, which proceeds via a six‐membered cyclic aromatic TS (Scheme 2).35
Scheme 2.
Alder‐ene reaction (XY is, e.g., C2H4, C2H2, CH2NH, CH2O).
The associated barrier to the reaction is caused by the activation strain associated with deforming the reactants such that they adopt a cyclic geometry that is suitable for aromatic conjugation. The Alder‐ene barrier decreases if atoms of the third period become involved in the double bond of the enophile. Our activation strain analyses show that this trend in reactivity is related to the LUMO of the enophile becoming less suitably shaped for overlapping with the C−H bond of the hydrogen that is transferred from the ene to the enophile. Consequently, along this series, C−H bond breaking of the ene begins to lag behind the process of forming the new C−C bond of the ene–enophile addend. This yields a lower activation strain in the ene reactant and, thus, a lower overall reaction barrier.35
4.7. Homogeneous Catalysis
Metal‐mediated C−X bond activation plays a central role in many homogeneous catalytic processes.8 In several studies, we investigated the physical factors behind the effect of ligands in d10‐ML2 complexes on their activity in C−H, C−C, and C‐halogen activation reactions that feature as the selectivity‐determining step in various cross‐coupling mechanisms.36, 37, 38 Here, we focus on our activation strain analyses of the so‐called bite‐angle effect.36a,36b Analyses of the activation strain for other aspects of metal‐mediated bond activation can be found in Ref. 37. The bite‐angle effect is a well‐known quantity; the barrier for bond activation through oxidative insertion of the metal center in the C−X bond is lowered when the L‐M‐L angle in d10‐ML2 is reduced. For example, in the important class of palladium biphosphine complexes, this can be achieved by introducing a molecular scaffold, such as a polymethylene bridge, which tethers the coordinating phosphine centers and pulls them together.38 By varying the length of this bridge, one can obtain catalysts with different P‐Pd‐P bite angles that activate bonds with higher or lower barriers. This is illustrated in Figure 9 a, which compares the reaction potential energy surface (PES) for the C−H activation of methane through oxidative addition of a bare Pd atom, the archetypal Pd(PH3)2 complex, and a Pd[PH2(CH2)nPH2] chelate complex in which a short bimethylene bridge (n=2) reduces the P‐Pd‐P bite angle from 180° to 98°.37a,37b As can be seen, introducing ligands raises the barrier. On the other hand, reducing the bite angle lowers the barrier.
Figure 9.
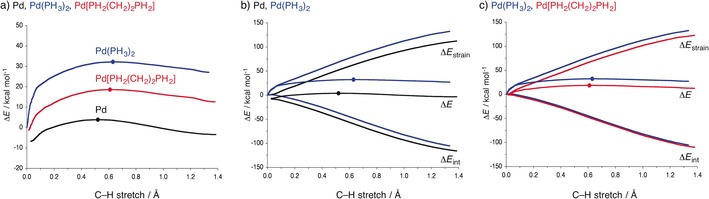
Reaction potential energy surfaces (a) and activation strain diagrams (b,c) of the oxidative insertion of Pd (black), Pd(PH3)2 (blue), and Pd[PH2(CH2)2PH2] (red) into the C−H bond of methane. The dots indicate the position of the TS.
Our activation strain analyses reveal that the higher barrier upon introducing ligands is to an important extent, although not exclusively, the result of a more destabilizing strain curve (Figure 9 b).36a,36b This is associated with the need to bend the ligands away upon coordination of the C−X bond that is going to be activated. The lower reaction barriers for complexes with smaller bite angles originate from a softer strain term.36a,36b The reason that a smaller bite angle goes along with less strain is the reduced need to further bend the phosphine ligands away upon the approach of the substrate. This prevents the strain energy term from rising at the start of the reaction, as found for Pd(PH3)2. The analyses clearly reveal that this geometric effect is the reason for the lower barriers, that is, the effect of the bite angle on the reaction barriers results from steric effects. The stronger donation from the destabilized metal dπ orbital of the catalyst also contributes a slightly more stabilizing catalyst–substrate interaction, but plays only a minor role. Interestingly, the catalyst strain can also be reduced, and the barrier thus reduced, by choosing metal–ligand combinations in nonchelating d10‐ML2 complexes that possess an intrinsic preference to adopt nonlinear L‐M‐L geometries. This occurs in situations of strong π‐backbonding36c–36e and/or in the case of non‐isotropically bulky ligands that stick together through their large surfaces by dispersion interactions.36f
Together with Merlic, we explained interesting changes in the regioselectivities of cross‐coupling reactions with different ligands by using the distortion/interaction model.39 Figures 10 and 11 show two examples of regioselectivities along with the distortion and interaction energies computed for these reactions. Figure 10 shows an example of a distortion‐controlled reaction, while Figure 11 is an interaction‐controlled case.
Figure 10.
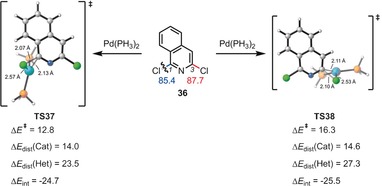
Energies and distortion/interaction analysis of transition states (TS37 and TS38) of the [Pd(PH3)2]‐mediated oxidative addition to the C−Cl bond of aryl chloride 36. Energies are in kcal mol−1.
Figure 11.
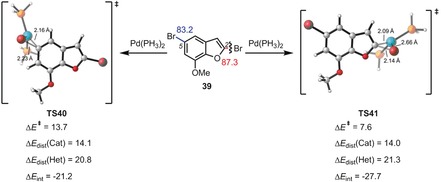
Energies and distortion/interaction analysis of the transition states of the [Pd(PH3)2]‐mediated oxidative addition to the C−Br bond of aryl bromide 39. Energies are in kcal mol−1.
The former occurs because of the greater ease of cleaving the C−Cl bond in a more crowded location, while the second example involves the large LUMO coefficient at C‐2 and consequently larger interaction energy with the Pd nucleophile. The reactivities of several iridium‐catalyzed Suzuki reactions were also investigated and rationalized with the distortion/interaction model.40
4.8. Organocatalysis
Two examples of the application of the distortion/interaction‐activation strain model are given in this section that show how the model can be used to explain stereoselectivities. Frequently, transition states of stereoisomeric transition states appear to have nearly identical steric environments, even when they differ significantly in energy. This is because distortion often occurs to reduce steric, that is, van der Waals, repulsions. A good example is in studies on the stereoselectivities of oxetane ring‐opening reactions catalyzed by chiral phosphoric acids. Figure 12 shows the reaction that was studied. Here, the catalyst 2 a caused 1 a (R′=Ph) to be opened to form 3 a with 94 % ee.41
Figure 12.
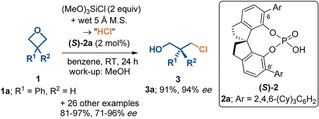
Stereoselective oxetene ring opening catalyzed by a chiral phosphoric acid.
The transition states leading to the major and minor products are shown in Figure 13. An overlay of the optimized catalyst and the two transition states for the catalyzed reactions is shown on the right‐hand side. The disfavored transition state shows substantial distortion from the relaxed catalyst geometry, and this unfavorable distortion in the transition state causes it to be disfavored. A similar analysis has led to an understanding of the stereoselectivity of the Nazarov cyclization with Tius's chiral thiourea catalysts.42
Figure 13.
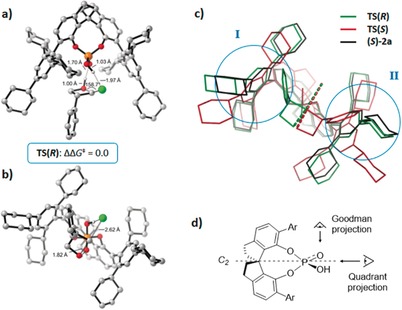
Transition states for oxetane ring‐opening reactions. These are overlapped on the catalyst structure on the right.
4.9. Reactivity and Regioselectivity of Aryne Additions and Cycloadditions
The Garg group has shown that nucleophilic additions to arynes, such as the indolynes shown in Figure 14, occur with high regioselectivities in several cases. The distortion/interaction‐activation strain model proved to be a reliable way to understand and predict the products of these reactions. The study by Cheong and co‐workers led to the breakthrough in this area,43a and it demonstrated the potential of this model to explain regioselectivities as well as reactivities.
Figure 14.
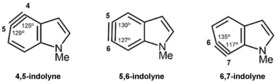
Structures of indolynes.
The internal angles computed for these indolynes (Figure 15) show that they are distorted. Nucleophilic attack at the more linear site (larger internal angle) is favored because it requires a minimum change in the geometry and energy in going from the indolynes to the TS geometry where the carbon atom attacked by the nucleophile has an internal angle of about 135°. Two of these transition states are shown in Figure 15.
Figure 15.
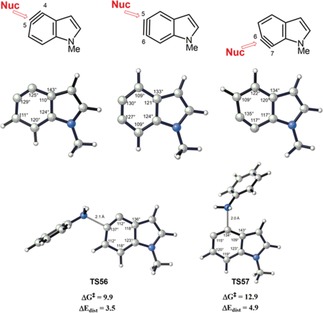
B3LYP/6‐31G(d)‐optimized structures of 4,5‐indolyne, 5,6‐indolyne, 6,7‐indolyne, and the transition structures (TS56 and TS57) for the addition of aniline to 4,5‐indolyne.
The computed distortion energies for TS56 and TS57 are 3.5 kcal mol−1 and 4.9 kcal mol−1, respectively. The relative reactivities are controlled by these distortion energies. The distortion/interaction‐activation model also successfully predicted the regioselectivities observed experimentally for other cases.43a–43f The more linear side of the aryne is also the favored site of nucleophilic attack experimentally. Larger differences in the internal angles correlate with higher degrees of regioselectivities.
Introducing the inductively withdrawing methoxy group at C3 to generate 3‐methoxybenzyne or 3‐methoxycyclohexyne distorts the aryne or alkyne significantly (Figure 16). Bent's rule43g states that the C3‐methoxy group causes rehybridization of C2. The more linear alkyne group at C1 of 3‐alkoxycycloalkynes is, once again, the preferred site for nucleophilic attack. Similar analyses have explained the regioselectivity in nucleophilic additions to 3,4‐pyridyne and piperidynes.43h
Figure 16.
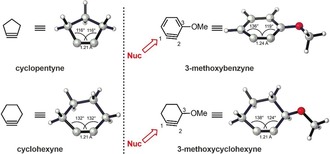
Optimized structures of 3‐methoxybenzyne and 3‐methoxycyclohexyne obtained using M06‐2X/6‐311+G(2d,p) and PCM(THF). The sites of the nucleophilic attack are shown.
5. Additional Aspects
5.1. Comparison to Marcus Theory
The Marcus theory of electron transfer relates the activation energy of a reaction to the thermodynamic parameters of the system.24 The potential energy for distortion of the system along a vibrational reaction coordinate (Figure 17) is represented by two parabolas, one for distortion of the reactants along the reaction coordinate and the second for distortion of products along the reaction coordinate. The reorganization energy λ is defined as the energy needed to distort the nuclear configuration of the reactants into that of the products without allowing electron transfer, or more generally, without relaxation of the electronic state.
Figure 17.
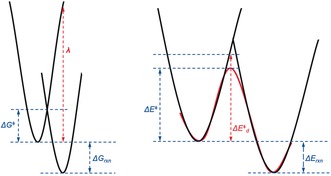
Energy terms involved in Marcus theory (left) in comparison to the D/I model (right).
By contrast, the distortion energy in our distortion/interaction or activation strain model defines the energy to distort the reactants into their geometries of the transition states (Figure 17, right). The shape of a potential energy curve for a reaction is roughly approximated by the overlap of the two parabolas, as used in Marcus theory.
Although these two models are quite different, they both reflect the fact that reactivity is determined by a combination of thermodynamics (reflected in ΔG rxn and ΔE rxn, which influences the position of the transition state) and the energies required to distort the reactants toward the product geometry. The reorganization energy is the energy to distort the reactant to the product without permitting relaxation of the electronic state.
5.2. Role of Solvation
The effect of solvation can be accounted for in this model in two ways. In the first case, one can compute the reaction strain and the interaction for the reactants in their solvated state.44 This yields the following variant of Equation (3), in which ΔE sol(ζ) represents reaction energy profile of the solution‐phase reaction [Eq. (7)].
| (7) |
In fact, this approach has been examined already in Section 4.1 on E2 versus SN2 reactivity. Therein, it was pointed out that solvation of the reaction system X−+CH3CH2Y stabilizes (the HOMO of) the base/nucleophile X−, as a consequence of which the interaction curve becomes less stabilizing.18b This causes the reaction strain to become more important in determining the overall trend in the energy barrier, which is to the advantage of the less‐distorted and thus less‐strained SN2 pathway (see Figure 3). Similar effects also apply to other organic as well as organometallic reactions such as metal‐mediated bond activation by either direct oxidative insertion or nucleophilic substitution.44
An interesting example can be found in our study on the palladium‐catalyzed C−X bond activation of halomethanes.44 This process can proceed through two stereochemically different pathways (Scheme 3, top): i) direct oxidative insertion (OxIn), which proceeds with retention of the configuration at C; and ii) SN2 substitution which proceeds with inversion of the configuration at C. Anion assistance, which we modeled by going from the model catalyst Pd to PdCl−, and solvation, simulated using COSMO, affect the overall reactivity and the selectivity between the OxIn and SN2 pathways (inversion of configuration). The SN2 pathway is inherently connected with a higher extent of distortion of the substrate in the TS, which leads to a higher activation strain and thus higher reaction barrier ΔE ≠ than for the OxIn reaction.
Scheme 3.
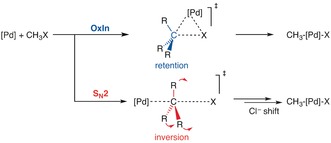
Oxidative addition by direct oxidative insertion (OxIn) or by nucleophilic substitution (SN2).
This situation can now be modulated through the TS interaction .44 This favors the SN2 pathway because the more deformed substrate is also a better partner in electrostatic and donor–acceptor orbital interactions. In other words, whenever the TS interaction is small, the trend in selectivity is determined more by the activation strain , and vice versa. Note how this competition between OxIn and SN2 (Scheme 3) parallels that between E2 and SN2 (Figure 3). The only difference is that the SN2 reaction is the more distortive pathway, which is disfavored by the strain but favored whenever interaction is strong, just like E2 in Figure 3. OxIn on the other hand plays the role of the SN2 reaction in Figure 3. Thus, anion assistance, which increases the bonding capabilities of the model catalyst, favors the SN2 pathway. On the other hand, solvation as well as anion assistance diminishes the bonding capabilities of the model catalyst and, therefore, favors the OxIn pathway again.
Alternatively, one can treat the solvent as a third agent that interacts with the reaction system or solute.45 Thus, the energy profile of the solution phase ΔE solution(ζ) has been decomposed along the reaction coordinate into the energy of the solute ΔE solute(ζ), namely, the reaction system in a vacuum but with its geometry in solution, plus the solvation energy ΔE solvation(ζ) [Eq. (8)]:
| (8) |
This decomposition constitutes a novel variant of our model, in which the ΔE strain(ζ) and ΔE int(ζ) terms that make up the intrinsic energy profile ΔE solute(ζ) of the solute are augmented by a solvation term ΔE solvation(ζ) [Eq. (9)].45
| (9) |
Note that ΔE solute(ζ) is often (but not necessarily) very similar to the PES of the actual gas‐phase reaction. The terms ΔE strain(ζ) and ΔE int(ζ) refer to the strain of, and mutual interaction between, the solute reactant molecules, respectively, in the geometry they have in solution, but in the absence of the solution (Figure 18). Thus, reaction strain is computed as the energy difference between the solute reaction system and the solute reactants in a vacuum. The solvation energy ΔE solvation(ζ) accounts for both the interaction of the solute with the solvent and the cavitation, that is, the formation of a cavity in the solvent through the presence of the solute.
Figure 18.
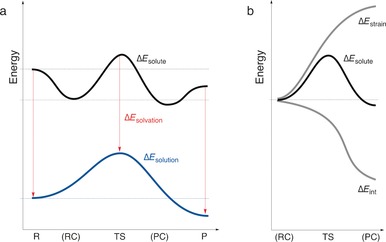
Activation strain model for solution‐phase reactions with solute–solvent interactions: a) The vacuum PES of the solute reaction system ΔE solute plus the solvation interaction between the solute and solvent ΔE solvation yield the solution‐phase PES ΔE solution. b) The vacuum PES of the solubilized reaction system is analyzed by decomposing into the strain and interaction.
This approach allows the usual analyses of the activation strain of solute reactants augmented with the effect of solute–solvent interactions. Analyses of SN2 substitutions at various electrophilic centers (e.g. SN2@C, SN2@Si, and SN2@P) as well as backside and frontside pathways of ion‐pair SN2 reactions show how solvation in most cases raises the reaction barriers and marginalizes the role of the reactant and product complexes that are often so prominent in the gas phase.45 This is achieved by differential solvation, that is, a stronger stabilization of the reactants and products than their respective complexes and especially the TS (Figure 18 a).
5.3. Applications to Unimolecular Reactions
This model, although originally conceived for bimolecular reactions, can also be applied to unimolecular reactions.46, 47 A straightforward way of dealing with this situation is to equate the activation energy and the activation strain because there is no second reactant to interact with, that is: ΔE ≠= . A more insightful approach is to identify, if possible, two fragments in the rearranging reactant that display a clear relative movement with respect to each other. An example is provided by type‐I 1,2‐dyotropic reactions, as shown in Equation (10) (E=C and Si; X=H, CH3, SiH3, F to I).46
| (10) |
As pointed out by Fernandez et al.,46a this reaction can be conceived as the interconversion between two (very strongly bound!) reactant complexes of X2+ER2=CR′2. In fact, this process strongly resembles a rotation of the [X ‐ ‐ ‐ X] fragment (or “reactant”) relative to the H2E=CH2 fragment (or “reactant”), as shown schematically in A.

This approach turns out to provide detailed insight into trends in activation energies by separating them into trends in the rigidity of X2 and H2E=CH2 as well as C−X bonding. The last term is directly determined by the electronic structure and bonding capability of the migrating groups X. In this picture, the energy barrier of the 1,2‐dyotropic reaction arises from the change in strain of, and interaction between, X2 and H2E=CH2 upon progressing from X−EH2−CH2−X to the TS [Eq. (11)].
| (11) |
The picture that emerges from these analyses is that reduced C−X bonding in the TS is the origin of the reaction barrier. Consequently, trends in reactivity on variation of X can be understood directly in terms of the ease of distorting the C−X bond into the TS geometry. For example, barriers decrease systematically as the C−X bond becomes weaker from C−F, C−Cl, C−Br, and C−I.46a
With Fernandez and Cossío,47 we have explored and analyzed the trend in the reactivity of the thermal cycloisomerization of 1,3‐hexadien‐5‐ynes, A=B−C=D−E≡F. This reaction leads to the formation of a bent allene intermediate with relatively high activation barriers, followed by a rapid 1,2‐H shift to yield a six‐membered aromatic core. Activation strain analyses show that the major factor controlling this Hopf cyclization is the geometrical strain energy associated with the rotation of the terminal [A] group around its double bond. This rotation is necessary for achieving a favorable HOMO–LUMO overlap with the alkyne moiety [F] associated with the formation of the new A−F single bond.
The distortion/interaction‐activation strain model can also be applied to intramolecular reactions with a fragmentation scheme (Figure 19).48 Here, we compute the distortion and interaction energies of the reacting components, and then separately compute the distortion energy of the tether that holds the two fragments together. In Figure 19, the black solid curve on the left represents the potential energy surface of an intramolecular cycloaddition reaction. The reactive components of the substrate are colored in blue, and the tether that holds the reactive components together and makes this reaction unimolecular is colored in orange. Operationally, the reactive components in the ground‐state structures are separated, and hydrogen atoms are added to the atoms at which covalent bonds have been broken (Figure 19, bottom right). Single point energies are also calculated for the interacting reactive components in the transition state (Figure 19, middle right) and the separated reactive components that maintain the geometries in the transition state (Figure 19, top right). The sum of the total distortion ( ) and interaction energy ( ) gives the apparent activation energy . The difference between and is the distortion energy of the tether . This approach assumes that the distortion of the tether and the distortion of the reacting parts are additive. With this fragmentation scheme, intramolecular reactions can be treated with the distortion/interaction model.48
Figure 19.
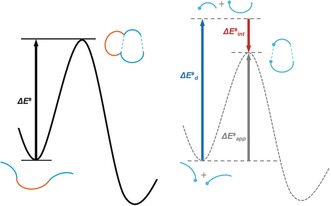
Left: Energy diagram for an intramolecular reaction. Right: distortion/interaction model for an intramolecular reaction with the tether removed.
6. Conclusion
The various applications discussed here illustrate the broad and general applicability of the transition‐state‐based model to both unimolecular and bimolecular chemical reactions. It builds on, and follows the same spirit as, Roald Hoffmann's1 qualitative perturbation models that explain so much chemistry and his further developments and applications of orbital correlation diagrams that were previously introduced by Walsh and others.49 The concepts of reaction strain and interaction are universally valid across all areas of the molecular sciences. They constitute a unifying approach to chemistry that highlights similarities and reveals common physical mechanisms behind seemingly unrelated phenomena.
Furthermore, our model is by definition exact, or as accurate as the quantum chemical method that is used. The model accounts for all factors (distortion, reaction strain, and interaction) that are required to arrive at the total activation energy. Therefore, it can be used to study major trends as well as subtle effects; in the words of Woodward and Hoffmann:5d “Violations—There are none!”
This model is not only universal and accurate, but it establishes a causal relationship between (observed or computed) trends in reactivity and underlying physical factors that are rooted in the molecular and electronic structures of the reactants. Thus, the distortion or activation strain depends on the rigidity of the reactants, on the strength of bonds that are breaking, and also the character of a particular reaction mechanism, that is, the extent to which the reactant structure must distort along the reaction pathway. Likewise, the interaction between the reactants depends on their shape and their electronic structure (orbital or VB). This model is a powerful aid for the rational design of chemical reactions.
Dedicated to Professor Roald Hoffmann on the occasion of his 80th birthday
Conflict of interest
The authors declare no conflict of interest.
Biographical Information
F. Matthias Bickelhaupt received his PhD at the University of Amsterdam with N. M. M. Nibbering and E. J. Baerends in 1993. Afterwards, he worked with P. von R. Schleyer, T. Ziegler, and R. Hoffmann, became Assistant Professor in Marburg, and obtained a full position in Amsterdam in 1999. Currently, he holds Chairs in Theoretical Chemistry at Vrije Universiteit Amsterdam and Radboud Universiteit Nijmegen. He is a member of the Royal Holland Society for Sciences and Humanities and received the VICI award (2002) of the Netherlands Organization for Scientific Research.

Biographical Information
Kendall N. Houk received his PhD at Harvard with R. B. Woodward in 1968, for experimental work on pericyclic reactions. During his career, he evolved into a computational organic chemist. After professorships at Louisiana State University and the University of Pittsburgh, he became the Saul Winstein Chair in Organic Chemistry at the University of California Los Angeles (UCLA). He is a Fellow of the American Academy of Arts and Sciences and a Member of the US National Academy of Sciences and the International Academy of Quantum Molecular Sciences.

Acknowledgements
We are grateful to the Netherlands Organization for Scientific Research (NWO) and the U.S. National Science Foundation (NSF CHE‐1361104) for financial support of this research. We thank Dr. Fang Liu and Dr. Trevor A. Hamlin for discussions and graphical assistance. We also thank Dr. Lando P. Wolters for creating the artwork and frontispiece.
F. M. Bickelhaupt, K. N. Houk, Angew. Chem. Int. Ed. 2017, 56, 10070.
Contributor Information
Prof. Dr. F. Matthias Bickelhaupt, Email: f.m.bickelhaupt@vu.nl.
Prof. Dr. Dr. Kendall N. Houk, Email: houk@chem.ucla.edu
References
- 1.
- 1a. Hoffmann R., Angew. Chem. Int. Ed. Engl. 1982, 21, 711–724; [Google Scholar]; Angew. Chem. 1982, 94, 725–739; [Google Scholar]
- 1b. Fukui K., Angew. Chem. Int. Ed. Engl. 1982, 21, 801–809; [Google Scholar]; Angew. Chem. 1982, 94, 852–861. [Google Scholar]
- 2.See also:
- 2a. Fleming I., Molecular Orbitals and Organic Chemical Reactions, Wiley, Chichester, 2009; [Google Scholar]
- 2b. Albright T. A., Burdett J. K., Whangbo M. H., Orbital Interactions in Chemistry , 2nd ed., Wiley, Hoboken, 2013. [Google Scholar]
- 3.
- 3a. Marcus R. A., J. Chem. Phys. 1956, 24, 966–978; [Google Scholar]
- 3b. Marcus R. A., J. Chem. Phys. 1956, 24, 979–989; [Google Scholar]
- 3c. Rehm D., Weller A., Ber. Bunsen-Ges. 1969, 73, 834–839. [Google Scholar]
- 4.
- 4a. Pross A., Shaik S. S., Acc. Chem. Res. 1983, 16, 363–370; [Google Scholar]
- 4b. Sevin A., Hiberty P. C., Lefour J.-M., J. Am. Chem. Soc. 1987, 109, 1845–1852; [Google Scholar]
- 4c. Shaik S. S., Hiberty P. C., A Chemist's Guide to Valence Bond Theory, Wiley-Interscience, Hoboken, 2008; for applications, see [Google Scholar]
- 4d. Mitchell D. J., Schlegel H. B., Shaik S. S., Wolfe S., Can. J. Chem. 1985, 63, 1642–1648; [Google Scholar]
- 4e. Shaik S., Shurki A., Angew. Chem. Int. Ed. 1999, 38, 586–625; [DOI] [PubMed] [Google Scholar]; Angew. Chem. 1999, 111, 616–657; [Google Scholar]
- 4f. Lai W., Li C., Chen H., Shaik S., Angew. Chem. Int. Ed. 2012, 51, 5556–5578; [DOI] [PubMed] [Google Scholar]; Angew. Chem. 2012, 124, 5652–5676; [Google Scholar]
- 4g. Braida B., Walter C., Engels B., Hiberty P., J. Am. Chem. Soc. 2010, 132, 7631–7637; [DOI] [PubMed] [Google Scholar]
- 4h. Usharani D., Janardanan D., Li C., Shaik S., Acc. Chem. Res. 2013, 46, 471–482; [DOI] [PubMed] [Google Scholar]
- 4i. Usharani D., Lacy D. C., Borovik A. S., Shaik S., J. Am. Chem. Soc. 2013, 135, 17090–17104; [DOI] [PMC free article] [PubMed] [Google Scholar]
- 4j. Li J., Zhou S., Zhang J., Schlangen M., Weiske T., Usharani D., Shaik S., Schwarz H., J. Am. Chem. Soc. 2016, 138, 7973–7981; [DOI] [PubMed] [Google Scholar]
- 4k. Li J., Zhou S., Zhang J., Schlangen M., Usharani D., Shaik S., Schwarz H., J. Am. Chem. Soc. 2016, 138, 11368–11377. [DOI] [PubMed] [Google Scholar]
- 5.
- 5a. Fukui K., Yonezawa T., Shingu H., J. Chem. Phys. 1952, 20, 722–725; see also: [Google Scholar]; Fleming I., Frontier Orbitals and Organic Chemical Reactions, Wiley, New York, 1978; [Google Scholar]
- 5b. Woodward R. B., Hoffmann R., J. Am. Chem. Soc. 1965, 87, 395–397; [Google Scholar]
- 5c. Longuet-Higgins H. C., Abrahamson E. W., J. Am. Chem. Soc. 1965, 87, 2045–2046; [Google Scholar]
- 5d. Woodward R. B., Hoffmann R., Angew. Chem. Int. Ed. Engl. 1969, 8, 781–853; [Google Scholar]; Angew. Chem. 1969, 81, 797–869; see also: [Google Scholar]
- 5e. Hammett L., Physical Organic Chemistry, 2nd Ed., McGraw Hill, New York, 1970. [Google Scholar]
- 6.See, for example:
- 6a. Bickelhaupt F. M., J. Comput. Chem. 1999, 20, 114–128; [Google Scholar]
- 6b. Fernández I., Bickelhaupt F. M., Chem. Soc. Rev. 2014, 43, 4953–4967; [DOI] [PubMed] [Google Scholar]
- 6c. Wolters L. P., Bickelhaupt F. M., WIRES Comput. Mol. Sci. 2015, 5, 324–343. [DOI] [PMC free article] [PubMed] [Google Scholar]
- 7.See, for example:
- 7a. Ess D. H., Houk K. N., J. Am. Chem. Soc. 2007, 129, 10646–10647; [DOI] [PubMed] [Google Scholar]
- 7b. Ess D. H., Houk K. N., J. Am. Chem. Soc. 2008, 130, 10187–10198; [DOI] [PubMed] [Google Scholar]
- 7c. Houk K. N., Liu Fang, Yang Yun-Fang, Hong Xin, Applied Theoretical Organic Chemistry (Ed.: D. Tantillo), World Scientific, 2017; [Google Scholar]
- 7d. Liu F., Liang Y., Houk K. N., Acc. Chem. Res. 2017, 50, 539–543. [DOI] [PubMed] [Google Scholar]
- 8.See, for example:
- 8a. Smith M. B., March's Advances Organic Chemistry, 7th ed., Wiley, Hoboken, 2013; [Google Scholar]
- 8b. Reichardt C., Welton T., Solvents and Solvent Effects in Organic Chemistry, 4th ed., Wiley-VCH, Weinheim, 2011; [Google Scholar]
- 8c. Hartwig J. F., Organotransition Metal Chemistry: From Bonding to Catalysis, University Science Books, Sausalito, 2010. [Google Scholar]
- 9.In the extreme case, reactions may become possible because they undergo bonding stepwise processes that avoid cyclic antiaromatic transition states.
- 10. Bickelhaupt F. M., Baerends E. J., In: Reviews in Computational Chemistry, Vol. 15 (Eds.: K. B. Lipkowitz, D. B. Boyd), Wiley-VCH, Weinheim, 2000, pp. 1–86. [Google Scholar]
- 11.
- 11a. Morokuma K., J. Chem. Phys. 1971, 55, 1236–1244; [Google Scholar]
- 11b. Ziegler T., Rauk A., Theor. Chim. Acta 1977, 46, 1–10. [Google Scholar]
- 12.
- 12a. González C., Schlegel H. B., J. Phys. Chem. 1990, 94, 5523–5527, and references therein. [Google Scholar]
- 13.
- 13a. van Zeist W.-J., Koers A. H., Wolters L. P., Bickelhaupt F. M., J. Chem. Theory Comput. 2008, 4, 920–928; [DOI] [PubMed] [Google Scholar]
- 13b. van Zeist W.-J., Fonseca Guerra C., Bickelhaupt F. M., J. Comput. Chem. 2008, 29, 312–315. [DOI] [PubMed] [Google Scholar]
- 14. Bento A. P., Bickelhaupt F. M., J. Org. Chem. 2008, 73, 7290–7299. [DOI] [PubMed] [Google Scholar]
- 15. Jencks W. P., Chem. Rev. 1985, 85, 511–527. [Google Scholar]
- 16. Hammond G. S., J. Am. Chem. Soc. 1955, 77, 334–338. [Google Scholar]
- 17.
- 17a. Kubelka J., Bickelhaupt F. M., J. Phys. Chem. A 2017, 121, 885–891; [DOI] [PMC free article] [PubMed] [Google Scholar]
- 17b. Rocha M. V. J., Smits N. W. G., Wolters L. P., de Cózar A., Guerra C. Fonseca, Ramalho T. C., Bickelhaupt F. M., Int. J. Mass Spectrom. 2017, 413, 85–91; [Google Scholar]
- 17c. de Cózar A., Ortega-Carrasco E., San Sebastián E., Larrañaga O., Maréchal J.-D., Bickelhaupt F. M., Cossio F. P., ChemPhysChem 2016, 17, 3932–3947; [DOI] [PubMed] [Google Scholar]
- 17d. van Zeist W.-J., Bickelhaupt F. M., Chem. Eur. J. 2010, 16, 5538–5541; [DOI] [PubMed] [Google Scholar]
- 17e. Bento A. P., Bickelhaupt F. M., Chem. Asian J. 2008, 3, 1783–1792; [DOI] [PubMed] [Google Scholar]
- 17f. Bento A. P., Bickelhaupt F. M., J. Org. Chem. 2007, 72, 2201–2207; [DOI] [PubMed] [Google Scholar]
- 17g. van Bochove M. A., Swart M., Bickelhaupt F. M., J. Am. Chem. Soc. 2006, 128, 10738–10744; [DOI] [PubMed] [Google Scholar]
- 17h. Bickelhaupt F. M., de Koning L. J., Nibbering N. M. M., Baerends E. J., J. Phys. Org. Chem. 1992, 5, 179–190. [Google Scholar]
- 18.
- 18a. Bickelhaupt F. M., Baerends E. J., Nibbering N. M. M., Ziegler T., J. Am. Chem. Soc. 1993, 115, 9160–9173; [Google Scholar]
- 18b. Bickelhaupt F. M., Baerends E. J., Nibbering N. M. M., Chem. Eur. J. 1996, 2, 196–207; [Google Scholar]
- 18c. Wolters L. P., Ren Y., Bickelhaupt F. M., ChemistryOpen 2014, 3, 29–36; [DOI] [PMC free article] [PubMed] [Google Scholar]
- 18d.P. Jansen, M. Swart, F. M. Bickelhaupt, unpublished results.
- 19.For the electronic structures and gas-phase basicities, respectively, of halides, see
- 19a. van Zeist W.-J., Ren Y., Bickelhaupt F. M., Sci. China Chem. 2010, 53, 210–215; [Google Scholar]
- 19b. Swart M., Bickelhaupt F. M., J. Chem. Theory Comput. 2006, 2, 281–287. [DOI] [PubMed] [Google Scholar]
- 20. Bickelhaupt F. M., Hermann H. L., Boche G., Angew. Chem. Int. Ed. 2006, 45, 823–826; [DOI] [PubMed] [Google Scholar]; Angew. Chem. 2006, 118, 838–841. [Google Scholar]
- 21.See, for example:
- 21a. Nibbering N. M. M., Int. J. Mass Spectrom. 2015, 377, 10–22, and references cited therein; [Google Scholar]
- 21b. Nibbering N. M. M., Mass Spectrom. Rev. 2006, 25, 962–1017; [DOI] [PubMed] [Google Scholar]
- 21c. Bickelhaupt F. M., Mass Spectrom. Rev. 2001, 20, 347–361; [DOI] [PubMed] [Google Scholar]
- 21d. Nibbering N. M. M., Adv. Phys. Org. Chem. 1988, 24, 1–55; [Google Scholar]
- 21e. Ingold C., Structure and Mechanism in Organic Chemistry, Cornell University Press, Ithaca, NY, 1969. [Google Scholar]
- 22.
- 22a. Strozier R. W., Caramella P., Houk K. N., J. Am. Chem. Soc. 1979, 101, 1340–1343; [Google Scholar]
- 22b. Rondan N. G., Domelsmith L. N., Houk K. N., Bowne A. T., Levin R. H., Tetrahedron Lett. 1979, 20, 3237–3240; [Google Scholar]
- 22c. Houk K. N., Frontiers of Free Radical Chemistry, (Ed.: W. A. Pryor), Academic Press, NY, 1980, pp. 43–71; [Google Scholar]
- 22d. Rondan N. G., Paddon-Row M. N., Caramella P., Houk K. N., J. Am. Chem. Soc. 1981, 103, 2436–2438. [Google Scholar]
- 23.
- 23a. Hayden A. E., Houk K. N., J. Am. Chem. Soc. 2009, 131, 4084–4089; [DOI] [PubMed] [Google Scholar]
- 23b. Osuna S., Houk K. N., Chem. Eur. J. 2009, 15, 13219–13231. [DOI] [PubMed] [Google Scholar]
- 24. Marcus R. A., Annu. Rev. Phys. Chem. 1964, 15, 155–196. [Google Scholar]
- 25.
- 25a. Paton R. S., Kim S., Ross A. G., Danishefsky S. J., Houk K. N., Angew. Chem. Int. Ed. 2011, 50, 10366–10368; [DOI] [PubMed] [Google Scholar]; Angew. Chem. 2011, 123, 10550–10552; [Google Scholar]
- 25b. Liu F., Paton R. S., Kim S., Liang Y., Houk K. N., J. Am. Chem. Soc. 2013, 135, 15642–15649. [DOI] [PubMed] [Google Scholar]
- 26. Levandowski B. J., Houk K. N., J. Am. Chem. Soc. 2016, 138, 16731–16736. [DOI] [PubMed] [Google Scholar]
- 27. Lopez S. A., Houk K. N., J. Org. Chem. 2013, 78, 1778–1783. [DOI] [PubMed] [Google Scholar]
- 28. Hong X., Liang Y., Griffith A. K., Lambert T. H., Houk K. N., Chem. Sci. 2014, 5, 471–475. [Google Scholar]
- 29.
- 29a. Fernández I., Solà M., Bickelhaupt F. M., Chem. Eur. J. 2013, 19, 7416–7422; [DOI] [PubMed] [Google Scholar]
- 29b. Fernández I., Solà M., Bickelhaupt F. M., J. Chem. Theory Comput. 2014, 10, 3863–3870; [DOI] [PubMed] [Google Scholar]
- 29c. Bickelhaupt F. M., Solà M., Fernández I., Chem. Eur. J. 2015, 21, 5760–5768; [DOI] [PubMed] [Google Scholar]
- 29d. García-Rodeja Y., Solà M., Bickelhaupt F. M., Fernández I., Chem. Eur. J. 2016, 22, 1368–1378; [DOI] [PubMed] [Google Scholar]
- 29e. Martínez J. P., Langa F., Bickelhaupt F. M., Osuna S., Solà M., J. Phys. Chem. C 2016, 120, 1716–1726; [Google Scholar]
- 29f. Martínez J. P., Garcia-Borràs M., Osuna S., Poater J., Bickelhaupt F. M., Solà M., Chem. Eur. J. 2016, 22, 5953–5962. [DOI] [PubMed] [Google Scholar]
- 30.
- 30a. Hoye T. R., Baire B., Niu D., Willoughby P. H., Woods B. P., Nature 2012, 490, 208–212; [DOI] [PMC free article] [PubMed] [Google Scholar]
- 30b. Niu D., Hoye T. R., Nat. Chem. 2014, 6, 34–40. [DOI] [PMC free article] [PubMed] [Google Scholar]
- 31.
- 31a. Bradley A. Z., Johnson R. P., J. Am. Chem. Soc. 1997, 119, 9917–9918; [Google Scholar]
- 31b. Cahill K. J., Ajaz A., Johnson R. P., Aust. J. Chem. 2010, 63, 1007–1012. [Google Scholar]
- 32.
- 32a. Liang Y., Hong X., Yu P., Houk K. N., Org. Lett. 2014, 16, 5702–5705; [DOI] [PubMed] [Google Scholar]
- 32b. Yu P., Yang Z., Liang Y., Hong X., Li Y., Houk K. N., J. Am. Chem. Soc. 2016, 138, 8247–8252. [DOI] [PubMed] [Google Scholar]
- 33. Dommerholt J., van Rooijen O., Borrmann A., Fonseca Guerra C., Bickelhaupt F. M., van Delft F. L., Nat. Commun. 2014, 5, 5378. [DOI] [PubMed] [Google Scholar]
- 34.
- 34a. Ess D. H., Jones G. O., Houk K. N., Org. Lett. 2008, 10, 1633–1636; [DOI] [PubMed] [Google Scholar]
- 34b. Schoenebeck F., Ess D. H., Jones G. O., Houk K. N., J. Am. Chem. Soc. 2009, 131, 8121–8133; [DOI] [PubMed] [Google Scholar]
- 34c. Xu L., Doubleday C. E., Houk K. N., Angew. Chem. Int. Ed. 2009, 48, 2746–2748; [DOI] [PubMed] [Google Scholar]; Angew. Chem. 2009, 121, 2784–2786; [Google Scholar]
- 34d. Liang Y., Mackey J. L., Lopez S. A., Liu F., Houk K. N., J. Am. Chem. Soc. 2012, 134, 17904–17907; [DOI] [PubMed] [Google Scholar]
- 34e. Kamber D. N., Nazarova L. A., Liang Y., Lopez S. A., Patterson D. M., Shih H.-W., Houk K. N., Prescher J. A., J. Am. Chem. Soc. 2013, 135, 13680–13683; [DOI] [PubMed] [Google Scholar]
- 34f. Yang J., Liang Y., Seckute J., Houk K. N., Devaraj N. K., Chem. Eur. J. 2014, 20, 3365–3375; [DOI] [PMC free article] [PubMed] [Google Scholar]
- 34g. Kamber D. N., Liang Y., Blizzard R. J., Liu F., Mehl R. A., Houk K. N., Prescher J. A., J. Am. Chem. Soc. 2015, 137, 8388–8391; [DOI] [PubMed] [Google Scholar]
- 34h. Kumar Narayanam M., Liang Y., Houk K. N., Murphy J. M., Chem. Sci. 2016, 7, 1257–1261. [DOI] [PMC free article] [PubMed] [Google Scholar]
- 35. Fernández I., Bickelhaupt F. M., J. Comput. Chem. 2012, 33, 509–516. [DOI] [PubMed] [Google Scholar]
- 36.
- 36a. van Zeist W.-J., Visser R., Bickelhaupt F. M., Chem. Eur. J. 2009, 15, 6112–6115; [DOI] [PubMed] [Google Scholar]
- 36b. van Zeist W.-J., Bickelhaupt F. M., Dalton Trans. 2011, 40, 3028–3038; [DOI] [PubMed] [Google Scholar]
- 36c. Wolters L. P., Bickelhaupt F. M., Chem. Asian J. 2015, 10, 2272–2282; [DOI] [PubMed] [Google Scholar]
- 36d. Wolters L. P., van Zeist W. J., Bickelhaupt F. M., Chem. Eur. J. 2014, 20, 11370–11381; [DOI] [PubMed] [Google Scholar]
- 36e. Wolters L. P., Bickelhaupt F. M., ChemistryOpen 2013, 2, 106–114; [DOI] [PMC free article] [PubMed] [Google Scholar]
- 36f. Wolters L. P., Koekkoek R., Bickelhaupt F. M., ACS Catal. 2015, 5, 5766–5775. [Google Scholar]
- 37.See, for example:
- 37a. de Jong G. T., Bickelhaupt F. M., Can. J. Chem. 2009, 87, 806–817; [Google Scholar]
- 37b. van Eis M. J., Bickelhaupt F. M., van Loon S., Lutz M., Spek A. L., de Wolf W. H., van Zeist W.-J., Bickelhaupt F., Tetrahedron 2008, 64, 11641–11646; [Google Scholar]
- 37c. de Jong G. T., Bickelhaupt F. M., ChemPhysChem 2007, 8, 1170–1181; [DOI] [PubMed] [Google Scholar]
- 37d. de Jong G. T., Visser R., Bickelhaupt F. M., J. Organomet. Chem. 2006, 691, 4341–4349; [Google Scholar]
- 37e. Diefenbach A., Bickelhaupt F. M., J. Chem. Phys. 2001, 115, 4030–4040. [Google Scholar]
- 38. van Leeuwen P. W. N. M., Kamer P. C. J., Reek J. N. H., Dierkes P., Chem. Rev. 2000, 100, 2741–2769. [DOI] [PubMed] [Google Scholar]
- 39. Legault C. Y., Garcia Y., Merlic C. A., Houk K. N., J. Am. Chem. Soc. 2007, 129, 12664–12665. [DOI] [PubMed] [Google Scholar]
- 40. Green A. G., Liu P., Merlic C. A., Houk K. N., J. Am. Chem. Soc. 2014, 136, 4575–4583. [DOI] [PubMed] [Google Scholar]
- 41. Champagne P. A., Houk K. N., J. Am. Chem. Soc. 2016, 138, 12356–12359. [DOI] [PubMed] [Google Scholar]
- 42. Asari A. H., Lam Y.-h., Tius M. A., Houk K. N., J. Am. Chem. Soc. 2015, 137, 13191–13199. [DOI] [PubMed] [Google Scholar]
- 43.
- 43a. Im G.-Y. J., Bronner S. M., Goetz A. E., Paton R. S., Cheong P. H.-Y., Houk K. N., Garg N. K., J. Am. Chem. Soc. 2010, 132, 17933–17944; [DOI] [PMC free article] [PubMed] [Google Scholar]
- 43b. Cheong P. H.-Y., Paton R. S., Bronner S. M., Im G.-Y. J., Garg N. K., Houk K. N., J. Am. Chem. Soc. 2010, 132, 1267–1269; [DOI] [PMC free article] [PubMed] [Google Scholar]
- 43c. Bronner S. M., Mackey J. L., Houk K. N., Garg N. K., J. Am. Chem. Soc. 2012, 134, 13966–13969; [DOI] [PMC free article] [PubMed] [Google Scholar]
- 43d. Goetz A. E., Garg N. K., Nat. Chem. 2013, 5, 54–60; [DOI] [PMC free article] [PubMed] [Google Scholar]
- 43e. Medina J. M., Mackey J. L., Garg N. K., Houk K. N., J. Am. Chem. Soc. 2014, 136, 15798–15805; [DOI] [PMC free article] [PubMed] [Google Scholar]
- 43f. Medina J. M., McMahon T. C., Jiménez-Osés G., Houk K. N., Garg N. K., J. Am. Chem. Soc. 2014, 136, 14706–14709; [DOI] [PMC free article] [PubMed] [Google Scholar]
- 43g. Bent H. A., Chem. Rev. 1961, 61, 275–311; [Google Scholar]
- 43h. McMahon T. C., Medina J. M., Yang Y.-F., Simmons B. J., Houk K. N., Garg N. K., J. Am. Chem. Soc. 2015, 137, 4082–4085. [DOI] [PMC free article] [PubMed] [Google Scholar]
- 44. de Jong G. T., Bickelhaupt F. M., J. Chem. Theory Comput. 2007, 3, 514–529. [DOI] [PubMed] [Google Scholar]
- 45.
- 45a. Laloo J. Z. A., Rhyman L., Ramasami P., Bickelhaupt F. M., de Cozar A., Chem. Eur. J. 2016, 22, 4431–4439; [DOI] [PubMed] [Google Scholar]
- 45b. van Bochove M. A., Bickelhaupt F. M., Eur. J. Org. Chem. 2008, 649–654. [Google Scholar]
- 46.
- 46a. Fernández I., Bickelhaupt F. M., Cossío F. P., Chem. Eur. J. 2012, 18, 12395–12403; [DOI] [PubMed] [Google Scholar]
- 46b.for a review on dyotropic reactions, see Fernández I., Cossío F. P., Sierra M. A., Chem. Rev. 2009, 109, 6687–6711. [DOI] [PubMed] [Google Scholar]
- 47. Fernández I., Bickelhaupt F. M., Cossío F. P., Chem. Eur. J. 2014, 20, 10791–10801. [DOI] [PubMed] [Google Scholar]
- 48. Krenske E. H., Houk K. N., Holmes A. B., Thompson J., Tetrahedron Lett. 2011, 52, 2181–2184. [Google Scholar]
- 49. Walsh A. D., J. Chem. Soc. 1953, 2260–2266; [Google Scholar]; Walsh A. D., J. Chem. Soc. 1953, 2266–2288; [Google Scholar]; Walsh A. D., J. Chem. Soc. 1953, 2288–2296; [Google Scholar]; Walsh A. D., J. Chem. Soc. 1953, 2296–2301; [Google Scholar]; Walsh A. D., J. Chem. Soc. 1953, 2301–2306; [Google Scholar]; Walsh A. D., J. Chem. Soc. 1953, 2306–2317; [Google Scholar]; Walsh A. D., J. Chem. Soc. 1953, 2318–2320; [Google Scholar]; Walsh A. D., J. Chem. Soc. 1953, 2321–2324; [Google Scholar]; Walsh A. D., J. Chem. Soc. 1953, 2325–2329; [Google Scholar]; Walsh A. D., J. Chem. Soc. 1953, 2330–2331. [Google Scholar]