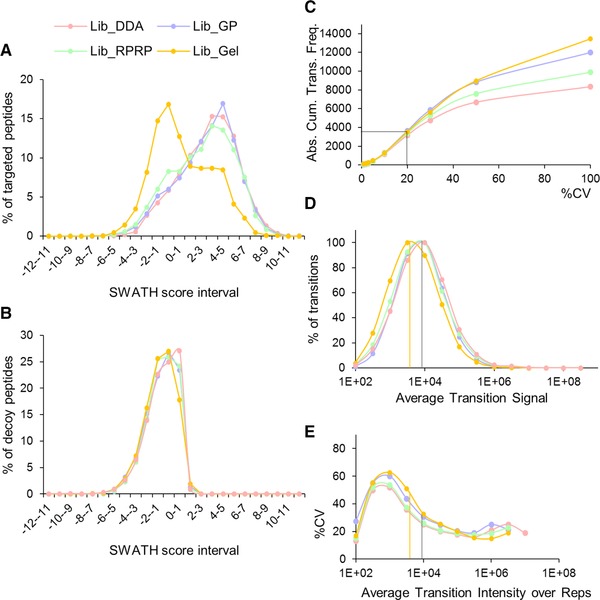
Figure 4.

Quality of peptide extraction (A–B) and reproducibility of transitions (C–E). (A) Distribution of the SWATH scores of all targeted peptides (1794 for Lib_DDA, 2579 for Lib_GP, 2172 for Lib_RPRP and 4903 for Lib_Gel) and (B) their decoys in the same SWATH file for the four different libraries. Overlays of the SWATH scores of the targeted and decoy peptides per library can be consulted in Supporting Information Fig. 5. (C–E) The same set of biological SWATH replicates (not repeated injections) from diff hESC (one to five) were matched with the different libraries. (C) Absolute cumulative CV distribution of the transitions. Note that CV 100% includes transitions with CV > 100%. (D) Dynamic range of the transitions extracted. (E) Median CV of the transitions in function of the dynamic range. Vertical bars depict the apex of the transition intensities for the Lib_Gel (yellow) and the other libraries (grey); these lines are projected onto (E) to show that this range intrinsically has higher %CV.
