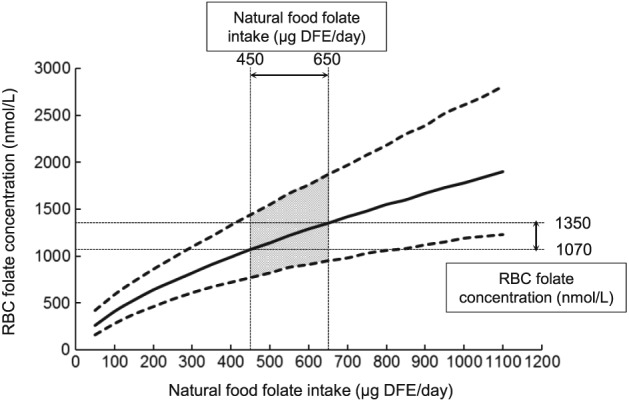
Figure 3.

Natural food folate intake (μg/day of DFE) and associated RBC folate concentrations (nmol/L) based on Bayesian modeling of the association between natural food folate intake and RBC folate concentration as analyzed by microbiological assay. Solid line represents the median value under the assumed model. Dotted lines represent the 95% credible interval. The shaded area (natural food intakes between 450 μg DFE/day and 650 g DFE/day) refer to the range of intakes and RBC folate concentrations associated with the lowest population risk for a NTD according to Crider et al. (2014). Based on data from Marchetta et al. (2015). DFE, dietary folate equivalent.
