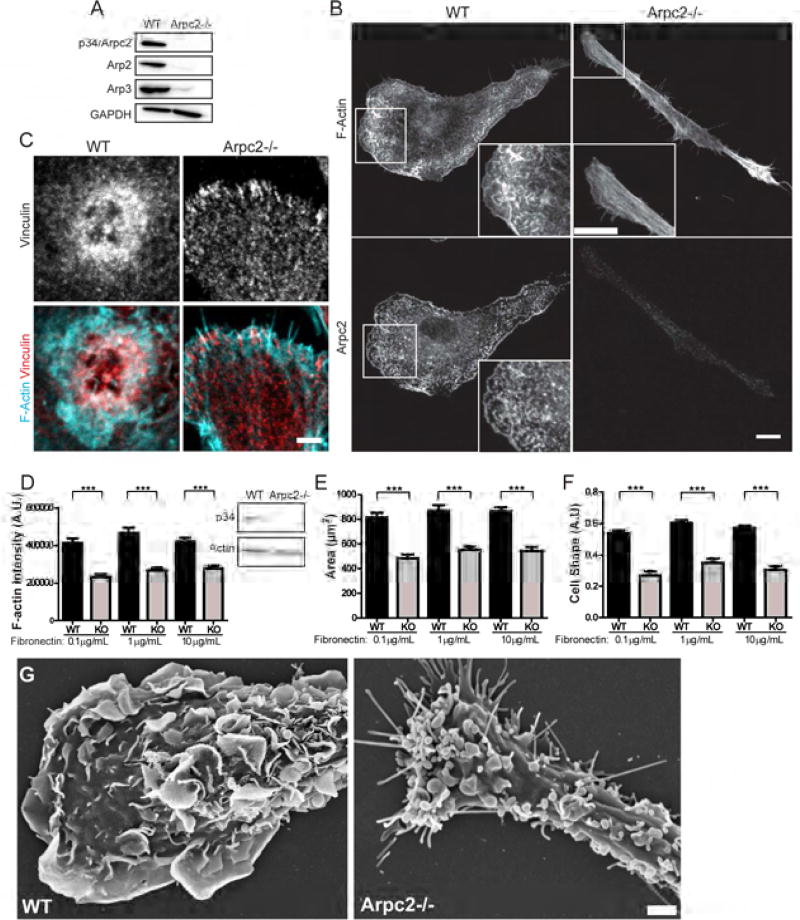
Figure 1. Arpc2−/− macrophage characterization and phenotypes.
A) Expression of Arp2/3 complex subunits in WT and Arpc2−/− macrophages. GAPDH is presented for loading comparison. B) Phalloidin (F-actin) and Arpc2 staining in WT and Arpc2−/− macrophages. Scale (image and inset) = 10 µm. C) Vinculin staining (grey) and merged staining of vinculin (red) and actin (cyan) in WT and Arpc2−/− macrophages. Scale = 3 µm. D) F-actin staining intensity of WT (black bars) and Arpc2−/− (KO, grey bars) macrophages on a range of fibronectin concentrations. Integrated pixel density plotted as mean ± SEM. ***p < 0.0001. A.U., Arbitrary Units. Blot panels display total actin level. N = at least 113 cells/condition, pooled from three separate experiments. E) Spread cell area in µm2, WT (black bars) or Arpc2−/− (KO, grey bars) macrophages on a range of fibronectin concentrations. Plotted as mean ± SEM. ***p < 0.0001. N = at least 113 cells/condition, pooled from three separate experiments. F) WT (black bars) and Arpc2−/− (KO, grey bars) macrophage cell shape on a range of fibronectin concentrations, plotted as mean ± SEM. A.U., Arbitrary Units. N = at least 77 cells/condition, pooled from three separate experiments. G) Scanning electron micrographs of WT and Arpc2−/− macrophages. Scale = 2 µm. See also Figure S1, Movie S1.

