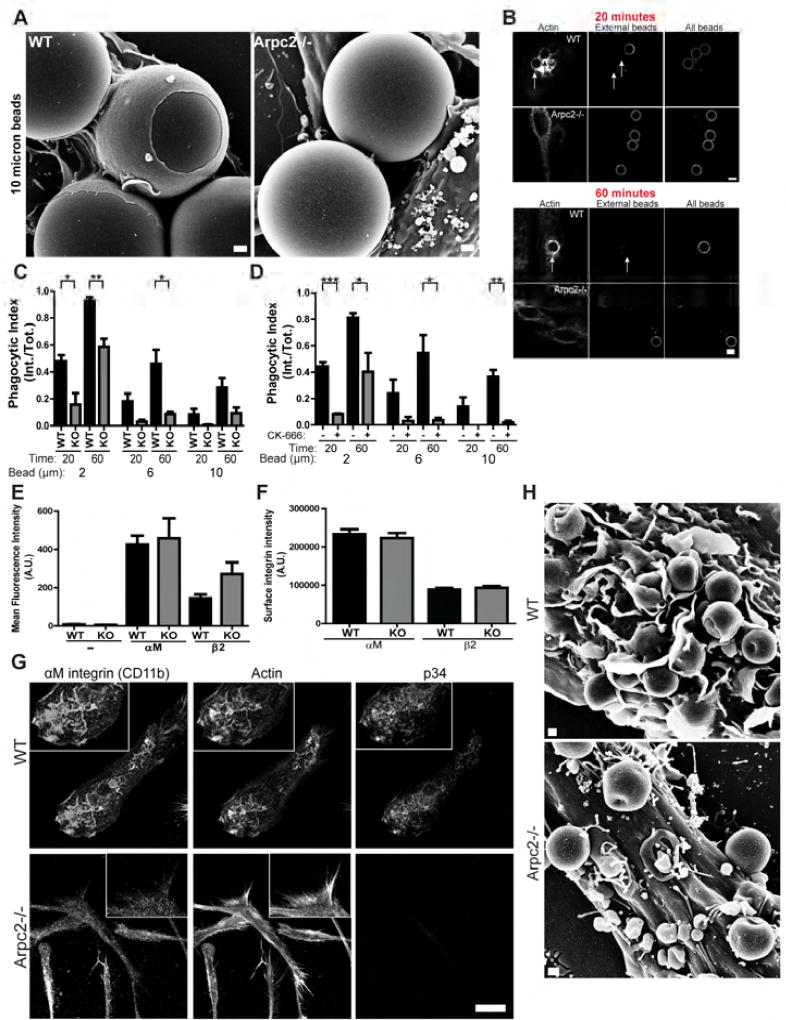
Figure 3. The Arp2/3 complex is critical for CR3 phagocytosis.
A) Scanning electron micrograph of WT and Arpc2−/− macrophages with 10 micron C3bi-coated beads. Scale = 1 µm. B) WT and Arpc2−/− macrophages at early (20 min.) and later (60 min.) time points bound to 6 micron beads. Staining (L to R): F-actin, external beads, all beads. Arrows denote internalized beads. Scale = 5 µm. C) Phagocytic index (internalized beads/total beads) of WT (black bars) or Arpc2−/− (KO, grey bars) macrophages at early (20 min.) or later (60 min.) time points with 2, 6, or 10 micron C3bi-opsonized beads. Data is plotted as mean ± SEM. **p = 0.0063, *p ≤ 0.0258. Means represent compiled data from three separate experiments. D) Phagocytic index (internalized beads/total beads) of WT macrophages acutely treated with DMSO (−, black bars) or 150 µM CK-666 (+, grey bars) at early (20 min.) or later (60 min.) time points with 2, 6, or 10 micron C3bi-opsonized beads. Data is plotted as mean ± SEM. ***p = 0.0005, **p = 0.0028, *p < 0.05. Means represent compiled data from three separate experiments. E) Flow cytometry analysis of αM and β2 integrin surface levels in WT (black bars) and Arpc2−/− (KO, grey bars) macrophages. Average Mean Fluorescence Intensity (MFI) of αM and β2 integrin on cultured macrophages were plotted ± SEM. Data were combined from three independent datasets. Negative control (−) cells were incubated with secondary antibody only. No statistically significant p-values were detected. A.U., Arbitrary Units. F) αM and β2 integrin surface levels on spread WT (black bars) and Arpc2−/− (KO, grey bars) macrophages in culture plated on 1 µg/mL collagen. Mean integrated pixel densities are plotted ± SEM. No statistically significant p-values were detected. A.U., Arbitrary Units. N = at least 132 cells. G) Confocal images (L to R, with insets) of αM integrin, F-actin and p34 in WT (top row) or Arpc2−/− macrophages (bottom row) plated on 1 µg/mL collagen. Scale = 20 µm. H) Scanning electron micrograph of WT or Arpc2−/− macrophages with bound C3bi-opsonized 2 micron beads. Scale = 500 nm. See also Figure S2.

