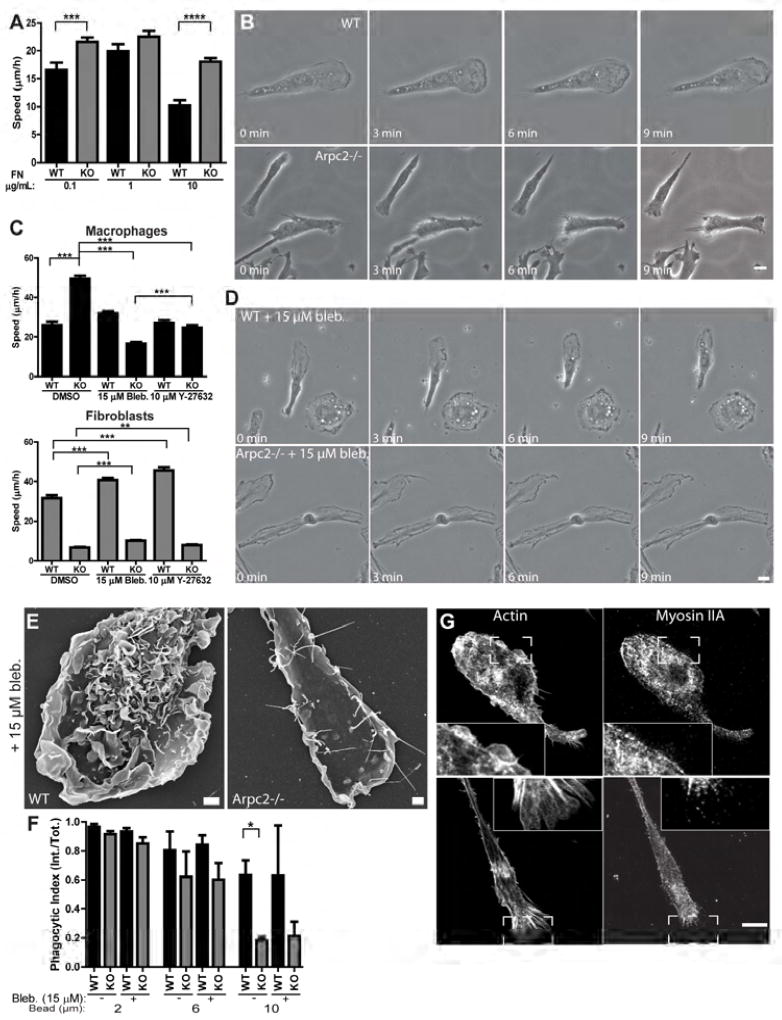
Figure 5. Enhanced Arpc2−/− macrophage motility requires myosin II.
A) Random migration speed of WT (black bars) or Arpc2−/− macrophages on a range of fibronectin concentrations (KO, grey bars) plotted as mean ± SEM. ****p < 0.0001, ***p = 0.0007. N = at least 89 cells, from 3 separate experiments. B) WT (top) and Arpc2−/− macrophages (bottom) migrating randomly on 1 µg/mL fibronectin. Scale = 10 µm. C) Random migration speed of macrophages (WT and KO, black bars) and fibroblasts (WT and KO, grey bars) in the presence or absence of myosin II-disrupting drugs (15 µM Blebbistatin and 10 µM Y-27632) on 1 µg/mL fibronectin. DMSO = negative control. ***p < 0.0001, **P = 0.0075. N = at least 114 cells, pooled from three separate experiments. D) WT (top) and Arpc2−/− macrophages (bottom) migrating randomly on 1 µg/mL fibronectin in the presence of 15 µM Blebbistatin. Scale = 10 µm. E) Scanning electron micrographs of WT and Arpc2−/− macrophages treated with 15 µM Blebbistatin. Scale = 2 µm. F) Phagocytic index (internalized beads/total beads) of WT (black bars) or Arpc2−/− macrophages (KO, grey bars) in the absence (−) or presence (+) of 15 µM Blebbistatin, after 60 minutes with 2, 6, or 10 micron IgG-opsonized beads. Data is plotted as mean ± SEM. *p = 0.0494. Means represent compiled data from three separate experiments. G) Confocal images, with insets, of F-actin (left) or myosin IIA (right) in WT (top) or Arpc2−/− macrophages (bottom) plated on 1 µg/mL fibronectin. Scale = 10 µm. See also Figure S5, Movie S3.

