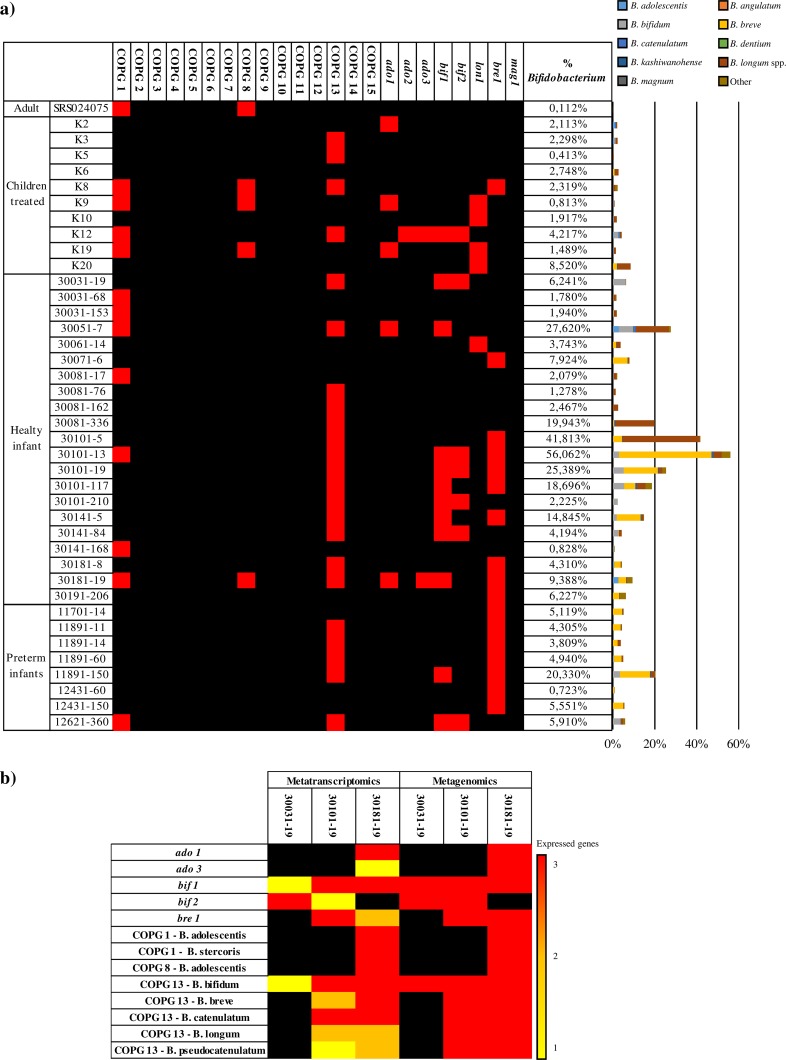
FIG 6.
Occurrence of bifidobacterial COPGs and PEL in fecal metagenome and metatranscriptome data sets. Panel a displays the presence of bifidobacterial COPGs and PEL in the metagenomic samples from adults, healthy infants, preterm infants, and children treated with antibiotics. Within the heat map, red squares indicate the presence of the relative COPGs and PEL in each metagenomic sample. Only those samples that possess a high abundance of bifidobacterial reads are reported in the heat map. The bar plot on the right shows the relative abundance of bifidobacterial species in the analyzed metagenomic samples, while the numbers at the top of the heat map correspond to the related COPGs. Panel b displays the presence of specific PEL and COPGs in metagenomic samples and their relative expression in the corresponding metatranscriptomic samples. Within the heat map, colored squares indicate the expression of one, two, or three genes of the locus, shown in yellow, orange, and red, respectively.

