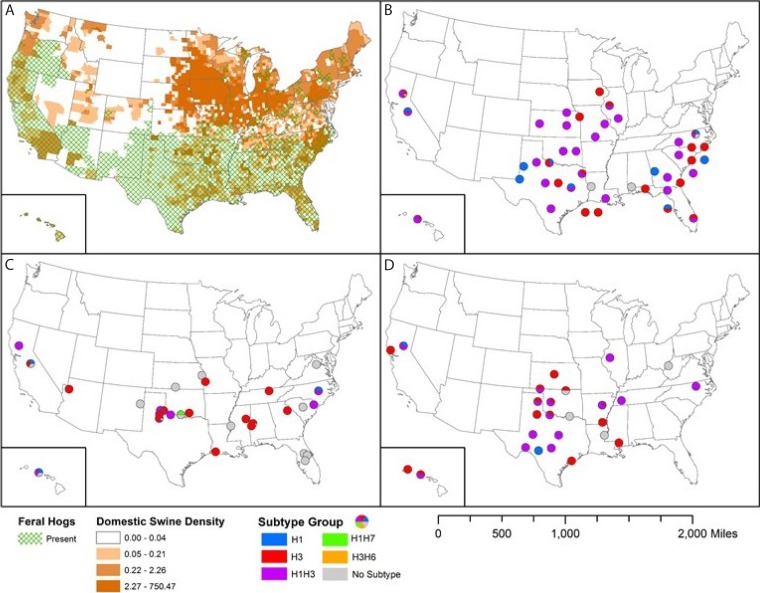
FIG 3.
Geographic distribution of domestic and feral swine across the United States and distribution of influenza A virus (IAV)-positive serum samples (by antigenic characterization) collected from feral swine during FY2011 to FY2013. (A) Distribution of feral and domestic swine; the domestic swine density values shown in the key are to be multiplied by 1,000,000 (e.g., 0.04 represents 40,000). (B to D) Antigenic characterization was determined by hemagglutination inhibition assay for FY2011 (B), FY2012 (C), and FY2013 (D). Dots (pie charts) indicate U.S. counties where samples positive for different IAV subtypes were collected.

