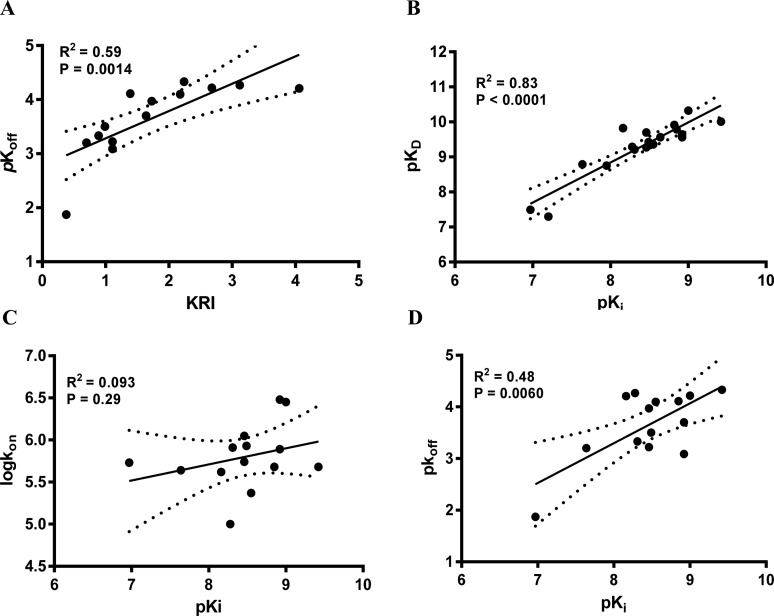
Figure 2.
Correlations between the negative logarithm of the human adenosine A3 receptor antagonists’ dissociation rates (pkoff) and their kinetic rate index (KRI) (A), the human adenosine A3 receptor antagonists’ affinity (pKi) and their “kinetic KD” (pKD) (B), association rate constants (log kon) (C), and dissociation rate constants (pkoff) (D). The central line corresponds to the linear regression of the data, the dotted lines represent the 95% confidence intervals for the regression. Data used in these plots are detailed in Tables 1–3. Data are expressed as mean from at least three independent experiments.

