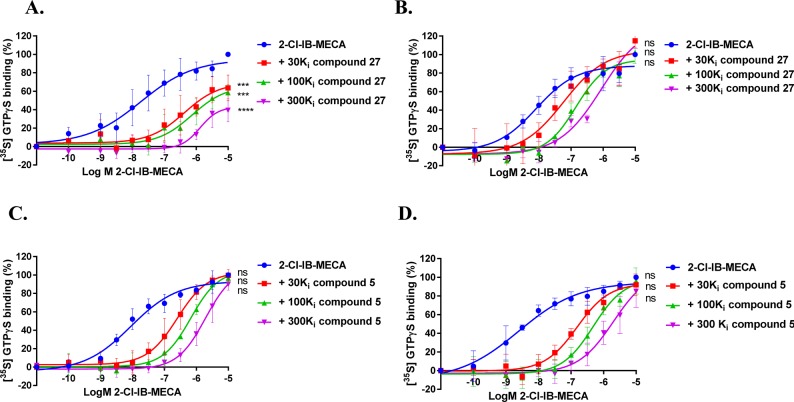
Figure 3.
2-Cl-IB-MECA-stimulated [35S] GTPγS binding to hA3R stably expressed on CHO cell membranes (25 °C) in the absence or presence of long-residence-time antagonist 27 (A and B, normalized and combined, n ≥ 3) or short-residence-time antagonist 5 (C and D, normalized and combined, n ≥ 3). Antagonist 27 (A) and 5 (C) were incubated for 60 min prior to the challenge of the hA3R agonist 2-Cl-IB-MECA, at a concentration ranging from 0.1 nM to 10 μM, for another 30 min. Antagonist 27 (B) and 5 (D) were coincubated with 2-Cl-IB-MECA, at the same concentration range, for 30 min. The agonist curves were generated in the presence of increasing concentrations of antagonists, namely 30-, 100-, and 300-fold their respective Ki values. Curves were fitted to a four parameter logistic dose–response equation. Data is from at least three independent experiments performed in duplicate, normalized according to the maximal response (100%) produced by 2-Cl-IB-MECA alone. The shift in agonist EC50 values was determined to perform Schild analyses. Two-way ANOVA with Dunnett’s post-test was applied for the comparison of Emax by agonist control, * p < 0.05, ** p < 0.01, *** p < 0.001, **** p < 0.0001, **** p < 0.0001, ns for not significant.

