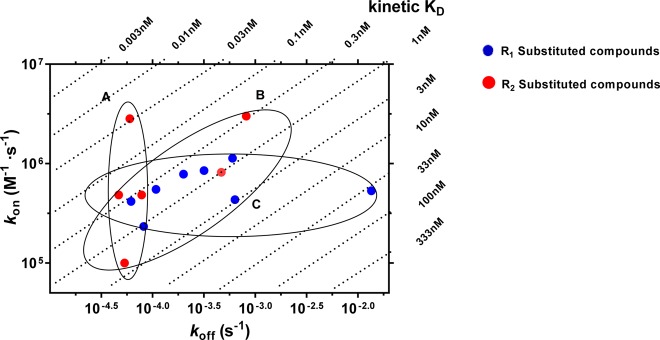
Figure 4.
Kinetic map (y axis, kon in M–1 s–1; x axis, koff in s–1) of all compounds that were kinetically characterized in this study. kon and koff values were obtained through competition association assays performed at the hA3R. The kinetically derived affinity (KD = koff/kon) is represented through diagonal parallel lines. Group A: compounds that show similar koff values but due to differing kon values have different KD values. Group B: compounds that display similar KD values despite showing divergent koff and kon values. Group C: compounds with similar kon values, but due to differing koff values have different KD values.

