
Figure 8.
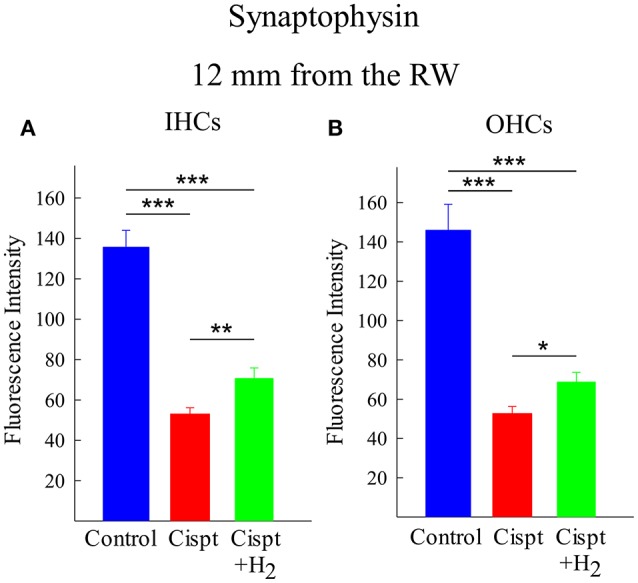
Quantification of the immunoreactivity of synaptophysin, using densitometry, in the synapse area of (A) IHCs and (B) OHCs at a distance of 12 mm from the RW in the Control group (blue), Cispt group (red), and Cisp+H2 group (green). The bars illustrate the mean intensity and the error bars represent SD. *p < 0.05, **p < 0.01, and ***p < 0.001.