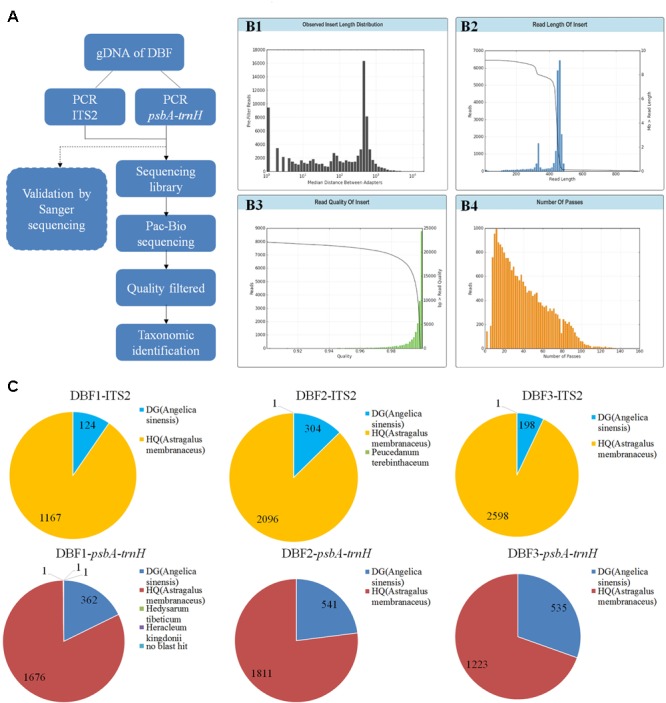
FIGURE 1.

PacBio sequencing procedure and results. The experimental procedure of PacBio sequencing is summarized (A). The read length distribution before filtering (B1). After quality filtering, the sequencing data underwent several quality evaluations to generate another read length distribution (B2), and statistics for the read quality (B3), and the number passes (B4). (C) Pie charts show the detailed annotation results for the filtered reads of ITS2 and psbA-trnH (for three parallel samples).
