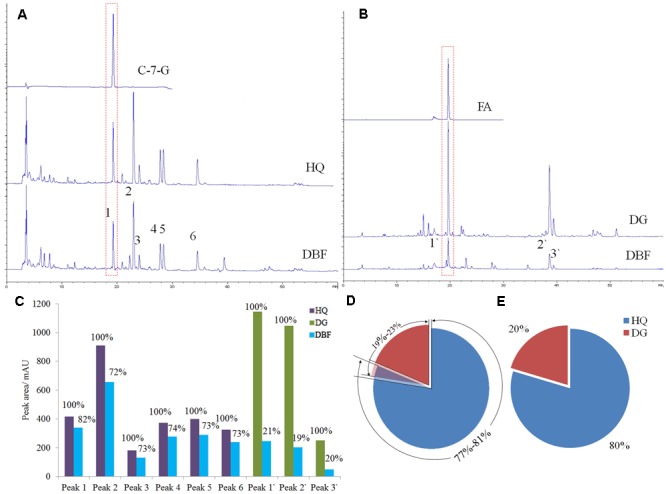
FIGURE 4.

HPLC analysis results of DBF, HQ, and DG. (A,B) The absorbent curves of the chemical markers, the independent samples (HQ and DG), and the complex herbal medicine (DBF), observed at wavelength of 254 and 316 nm, respectively. (C) The peak areas compared in a bar graph. (D,E) The portion of HQ and DG based, respectively, on their common peaks and two chemical markers.
