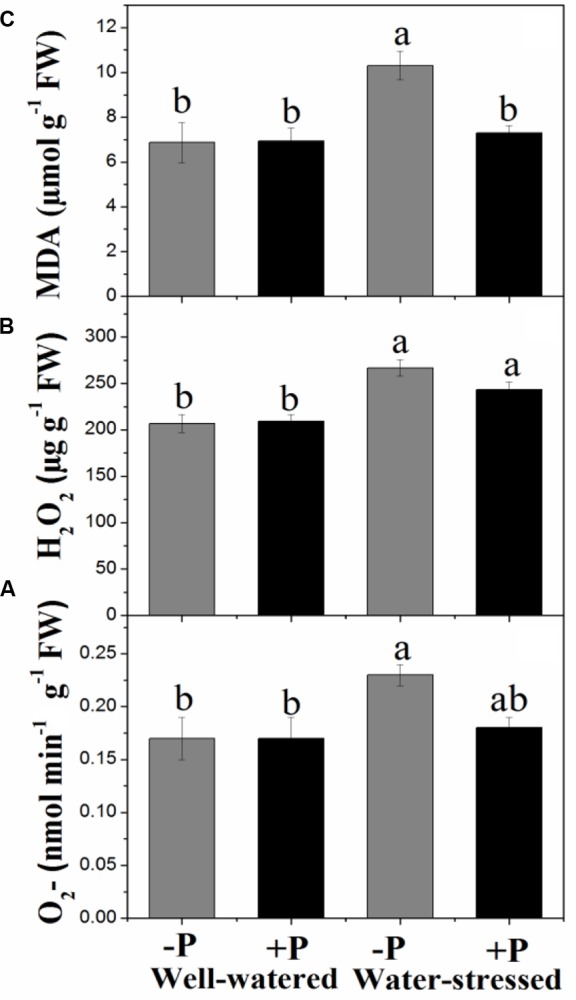
FIGURE 2.

Changes in superoxide anion (O2⋅-, A), hydrogen peroxide (H2O2,, B), and lipid peroxidation (MDA, C) for fertilized (+P) and non-fertilized (–P) treatments with and without water. Means followed by different letters indicate significant differences (P ≤ 0.05) among the four treatments according to Duncan’s test. Vertical bars show ± SE.
