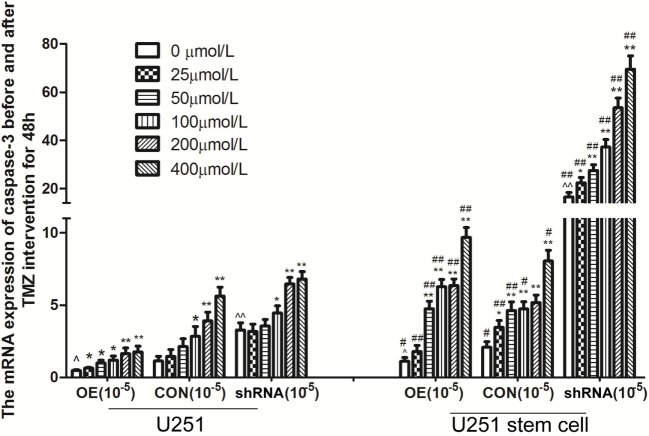
Figure 8.
The mRNA expression of caspase-3 before and after temozolomide (TMZ) intervention for 48 h in U251 cells and stem cells. Data presented as mean ± SD. *P < 0.05 and **P < 0.01, compared to the same cells with 0 µmol/L; ^P < 0.05 and ^^P < 0.01, OE compared to CON or siRNA compared to CON in same cell with 0 µmol/L, #P < 0.05 and ##P < 0.01, CSC compared to ACC as the same drug concentration in OE, CON and siRNA, respectively. U251; U251 stem cell; OE, overexpression Livin group; CON, control group; shRNA: shRNA-Livin group.

