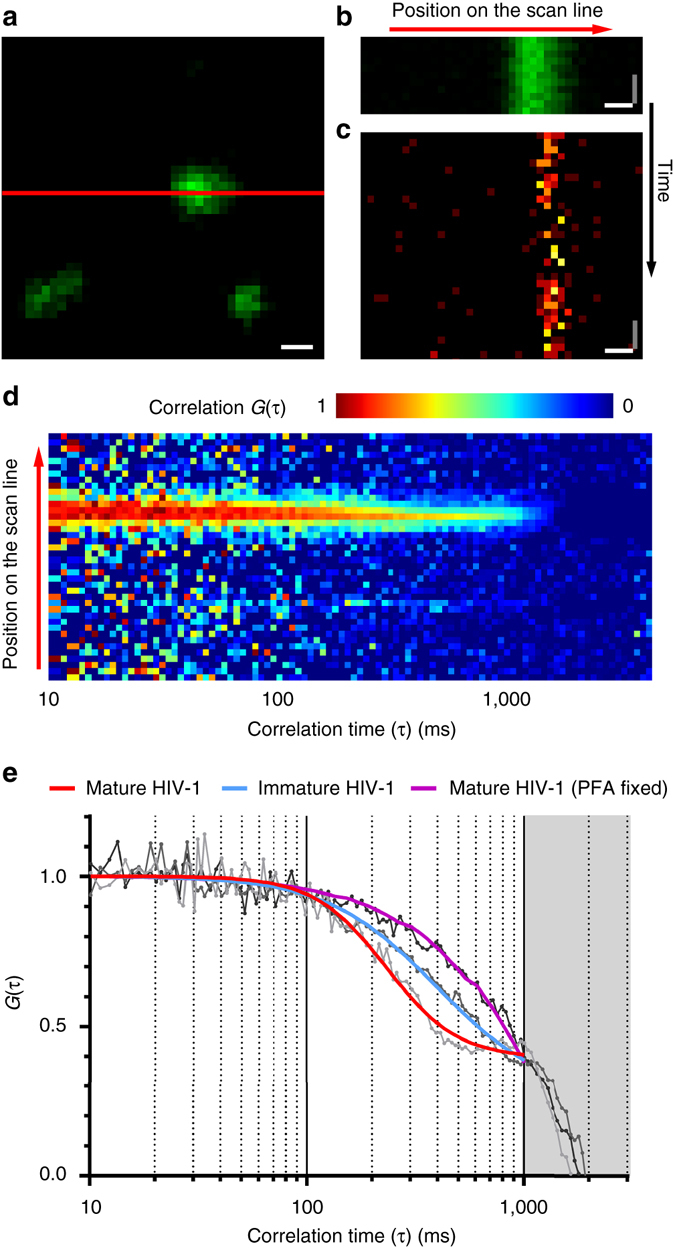
Fig. 2.

sSTED-FCS measurements of Env diffusion on HIV-1 particles. a Live confocal imaging was used to locate HIV-1 virus particles in a 2 µm × 2 µm imaging window using the eGFP.Vpr signal (green) as a guide and to align them with the position of the scan line (red). Scale bar: 200 nm. b, c Representative signal intensity carpets for eGFP.Vpr (green) in confocal mode and Env (orange) in STED mode on wild-type mature HIV-1 particles. Image x- and y-axis correspond to the position on the scan line and signal intensity at each time point, respectively. Scale bars: x-axis (white) = 200 nm, y-axis (grey) = 4.4 ms. d Correlation carpet generated from signal intensity carpet shown in c. Image x- and y-axis correspond to correlation time τ and the position on the scan line, respectively. Colour code corresponds to the normalised autocorrelation curves G(τ) at each position on the scan line. e Representative normalised autocorrelation curves of Env diffusion (grey and black lines) obtained from individual positions on the scan line within correlation carpets. Autocorrelation curves were fitted (coloured lines) for mature (red), immature (blue) and PFA fixed HIV-1 particles (purple) using generic two-dimensional diffusion model. Greyed out area corresponds to the photobleaching-only portion of the correlation data
