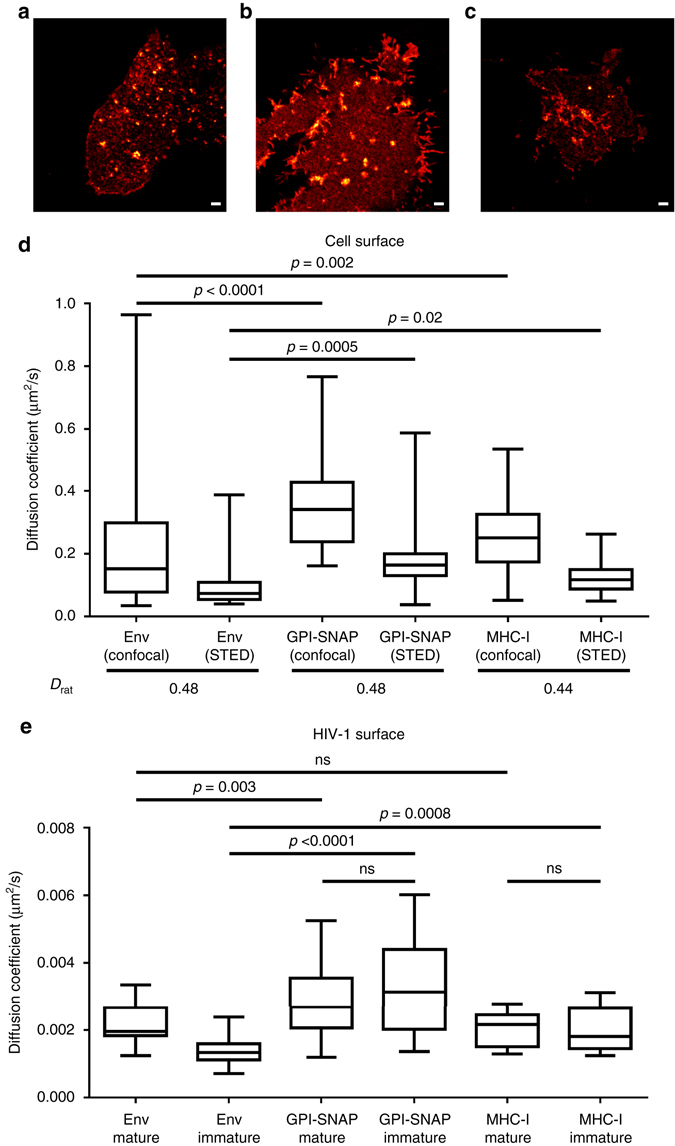
Fig. 4.

Comparison of protein molecular dynamics in cell and virus membranes. a–c Live confocal images of 293T cells expressing Env a and GPI-SNAP b supplied in trans, and endogenous MHC-I c. Env and MHC-I were visualised by immunostaining and GPI-SNAP by fluorescent SNAP tag substrate. Scale bars: 2 µm. d Median diffusion coefficients (D) of Env, GPI-SNAP and MHC-I cell surface mobility were determined by confocal FCS (D conf, observation spot diameter = 240 nm) and STED-FCS (D STED, observation spot diameter = 55 nm) measurements from 10 cells each in three independent experiments. Results are shown in a box (IQR) and whisker (min/max) plot. Ratios D rat = D STED/D conf, given below the x-axis, indicate trapped diffusion characteristics for all proteins (D rat < 1). The statistical significance was assessed by Wilcoxon rank-sum test. e D-values of Env, GPI-SNAP and MHC-I diffusion in mature and immature HIV-1 particles were determined by sSTED-FCS analysis of 50 particles each from two independent virus preparations. Results are shown in a box (IQR) and whisker (min/max) plot and the statistical significance was assessed by Wilcoxon rank-sum test
