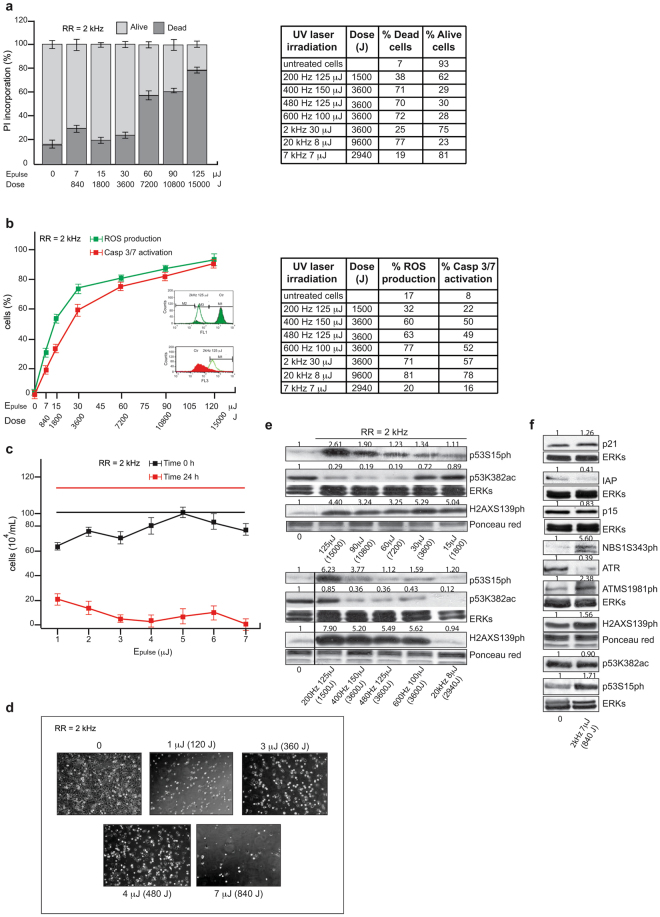
Figure 2.
Analysis of UV-mediated cell damage. (a,b) FACS analysis in MCF7 cells irradiated as indicated: (a) cell death for RR at 2 kHz (left) and variable (right); (b) caspase-3/7 activation and ROS production for RR at 2 kHz (left) and variable (right). Values are the average of experiments in triplicate with error bars indicating standard deviation. (c) Cell viability analysis with trypan blue at indicated times and energies. Values are the average of experiments in triplicate with error bars indicating standard deviation. (d) EVOS microscope digital photographs of cells irradiated as indicated. (e,f) Western blotting analysis for indicated damage targets in MCF7 cells irradiated at RR = 2 kHz with (d) variable Epulse and (e) at Epulse = 7 μJ. ERKs and Ponceau red were used as loading controls. Band quantification was performed using Image J software.

