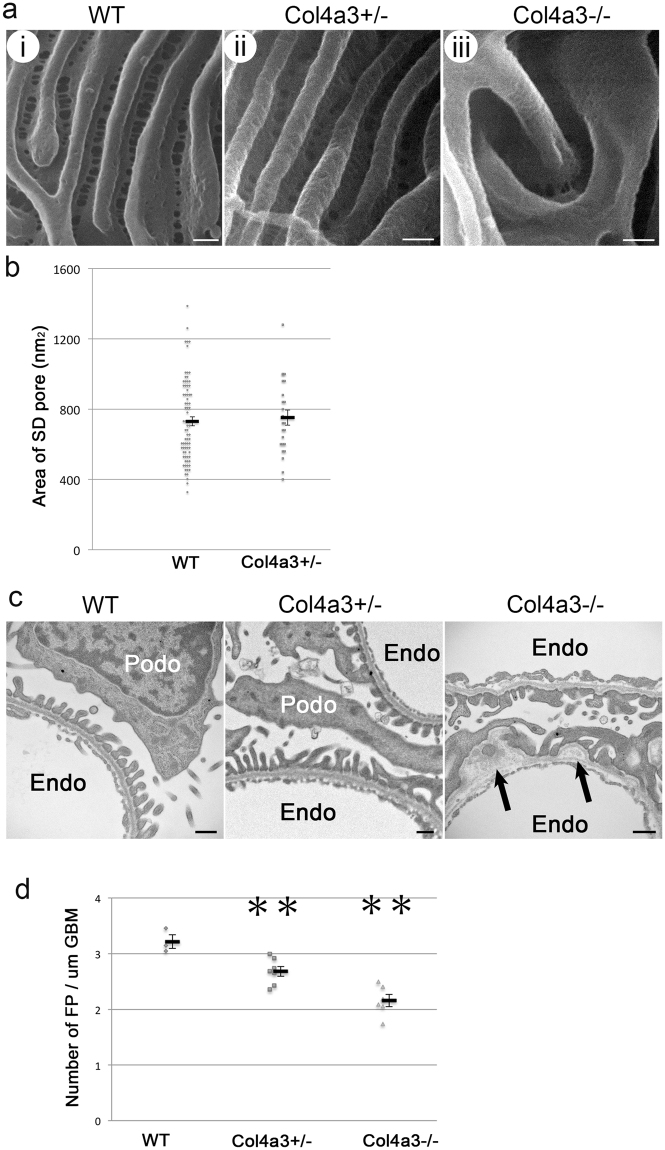
Figure 3.
Foot processes and filtration slits in wild-type and Col4a3 mutant mice. (a) HIM images of glomerular filtration slits in wild-type (WT) (i), Col4a3+/− (ii), and Col4a3−/− mice (iii). The WT kidney image (i) shows filtration regions between foot processes. The image of the foot processes in Col4a3+/− kidney (ii) shows a similar pattern to WT. In the Col4a3−/− kidney (iii), the slit pores are difficult to visualize due to the depth of the foot processes. Scale bar, 100 nm. (b) The size of the SD pores measured from HIM images in WT (n = 78) and Col4a3+/− (n = 24) mice shows no significant difference as assessed by Student’s t-test. Values are presented as means ± standard error of the mean (SEM) here and in the following plots. (c) Representative TEM images of WT, Col4a3+/−, and Col4a3−/− glomeruli. WT and Col4a3+/− glomeruli show normal GBM and associated foot processes. In Col4a3−/− glomeruli, the GBM was irregularly thickened and lamellated (arrow). Scale bar, 500 nm. Podo, podocyte; Endo, endocapillary space. (d) The number of foot process (FP) per unit GBM length (μm) is significantly lower in Col4a3+/− (n = 7) and Col4a3−/− (n = 6) compared to WT (n = 3) (**p < 0.01 by Student’s t-test). Each analysis includes approximately 10 μm GBM length.

