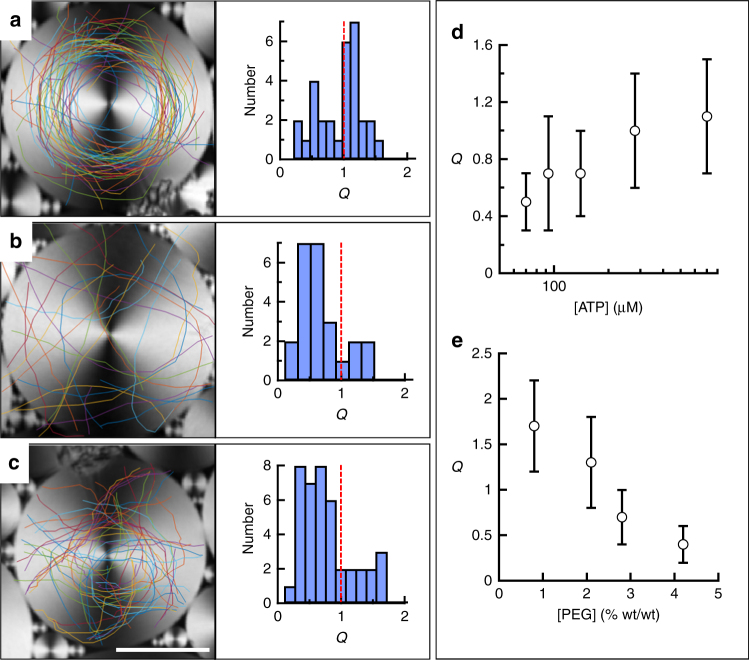
Fig. 3.
Soft confinement of the active nematic. Confocal reflection micrographs of different TFCDs and overlaid trajectories of +1/2 defects of the flowing AN for different experimental conditions: a [ATP] = 700 µM, [PEG] = 0.8% (wt/wt); b [ATP] = 70 µM, [PEG] = 0.8% (wt/wt); c [ATP] = 700 µM, [PEG] = 4.2% (wt/wt). Histograms next to micrographs include the distribution of measured winding numbers, Q. Scale bar 25 µm. Each line color corresponds to the trajectory of a different defect (Supplementary Movie 3). d Average value and standard deviation of Q for domains with diameter 60 μm, [PEG] = 1.6% (wt/wt), and different values of [ATP]. e Average value and standard deviation of Q for domains with diameter 60 μm, [ATP] = 1.4 mM, and different values of [PEG]. Error bars are the standard deviation for the measurements under each condition

