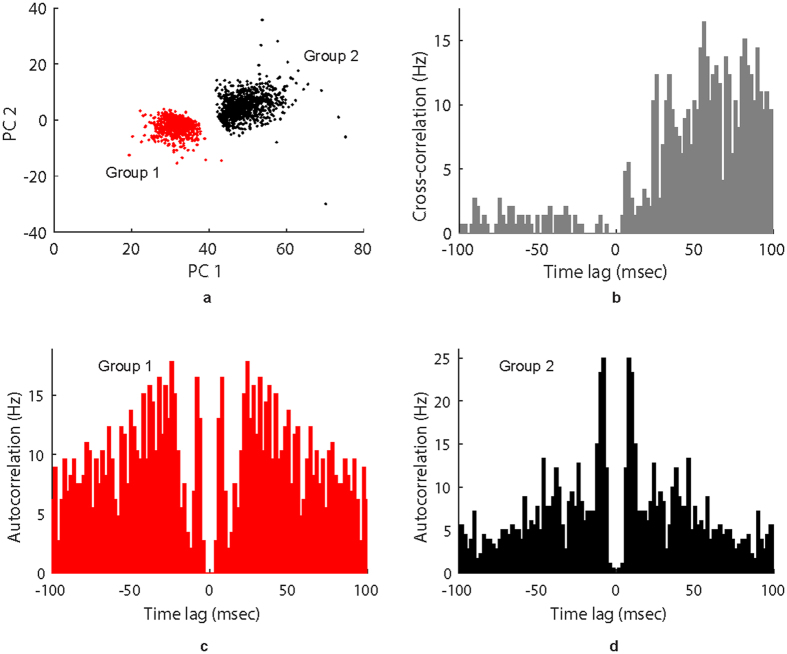
Figure 4.
Spike cluster separation 10 days post-implant. Several spike separation and quality metrics calculated from data collected 10 days after electrode implantation. (a) Representation of clusters 1 and 2 in the feature space, showing only the first two principal components for each spike. (b) Cross-correlation of spike times between clusters 1 and 2; bin width is 2 ms. (c) Auto-correlation of spike times from cluster 1; bin width is 2 ms. (d) Auto-correlation of spike times from cluster 2; bin width is 2 ms.

