
Figure 2.
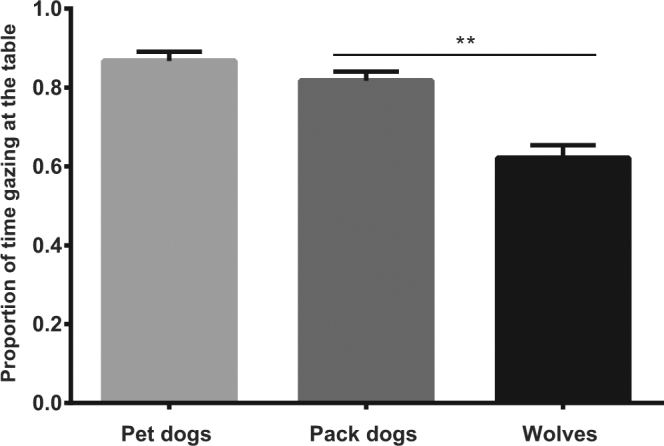
Mean proportion of time (including 95% confidence interval) that the groups gazed at the testing table. Significant difference is indicated by asterisk (*p < 0.05, **p < 0.01, ***p < 0.001).
Official websites use .gov
A
.gov website belongs to an official
government organization in the United States.
Secure .gov websites use HTTPS
A lock (
) or https:// means you've safely
connected to the .gov website. Share sensitive
information only on official, secure websites.
Mean proportion of time (including 95% confidence interval) that the groups gazed at the testing table. Significant difference is indicated by asterisk (*p < 0.05, **p < 0.01, ***p < 0.001).