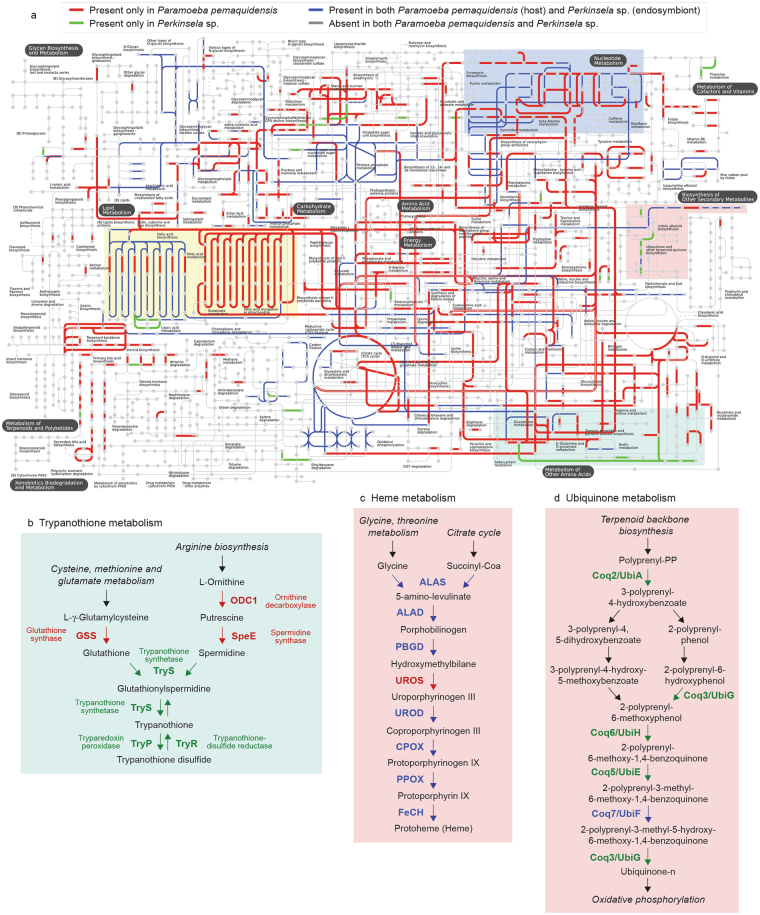
Figure 3.
Metabolic maps for Paramoeba pemaquidensis (host) and Perkinsela sp. (endosymbiont). (a) Global metabolic maps. Nodes represent metabolic compounds and lines represent enzyme-catalyzed biochemical reactions. Metabolic maps were based on KEGG annotations and generated using the interactive Pathways Explorer (iPath 2.0). Colored lines indicate enzymes/reactions predicted to be present in one or both organisms. (b–d) Close-ups of trypanothione, heme and ubiquinone metabolism, respectively. Color-coding corresponds to part a.

