Figure 3.

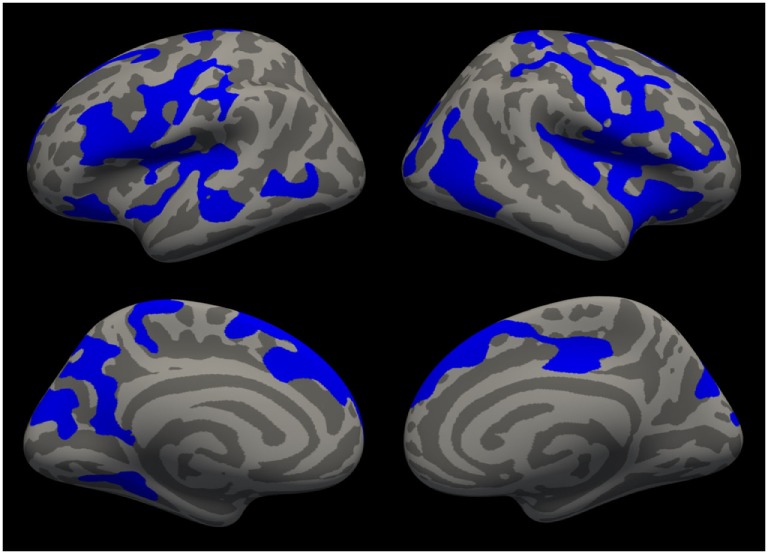
Cortical areas in which cortical thickness significantly decreases with age are shown in blue after cluster-wise correction for multiple comparisons (p < 0.01) for all patients (n = 64).

Cortical areas in which cortical thickness significantly decreases with age are shown in blue after cluster-wise correction for multiple comparisons (p < 0.01) for all patients (n = 64).