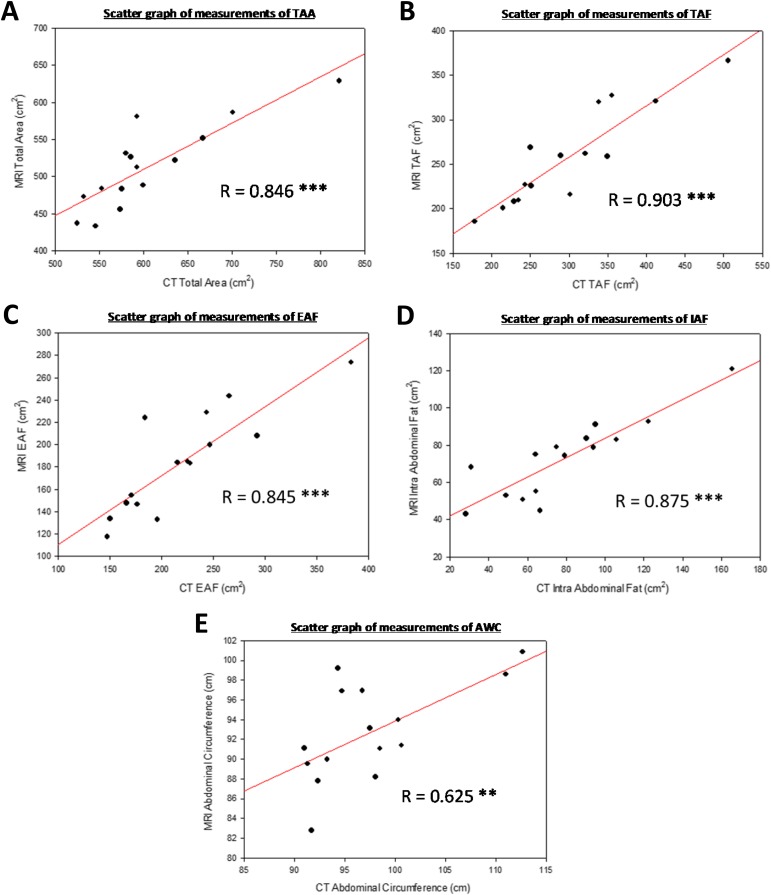
Figure 5.
Scatter graphs of measurements obtained with MRI and CT imaging for (a) total abdominal area (TAA), (b) total abdominal fat (TAF), (c) extra-abdominal fat (EAF), (d) intra-abdominal fat (IAF) and (e) abdominal waist circumference (AWC). All coefficients represent statistically significant positive correlations (Table 3). The regression lines are shown (solid line). R, Pearson's correlation coefficient. Statistical significance denoted as: *p ≤ 0.05; **p ≤ 0.01; ***p ≤ 0.001; NS, p > 0.05.

