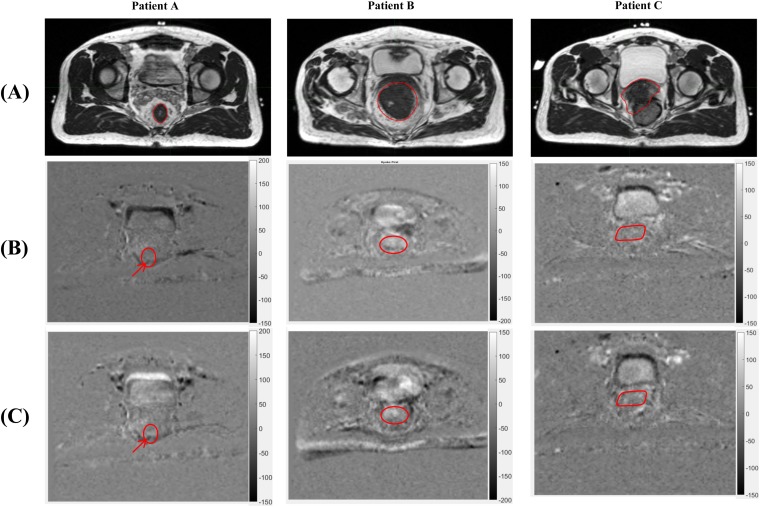
Figure 3.
Pixelwise longitudinal apparent diffusion coefficient (ADC) analysis showing longitudinal ADC trend of the region of interest (ROI) and differential in ADC value changes within subregions of the ROI. The greyscale represents the slope of the ADC change throughout neoadjuvant chemoradiation (NAC) with units of square millimetre per second fraction. Darker regions represent a negative slope of ADC change throughout NAC, reflecting a decrease in ADC. Brighter regions show a positive slope in ADC value changes, reflecting an increasing ADC. Three images are shown for each patient: (a) shows the high-resolution pre-treatment MRI scan with the primary tumour contoured in white, (b) shows the functional diffusion map (fDM) for the first portion of NAC with the tumour ROI contoured in white and (c) shows the fDM for the entire course of NAC with the tumour ROI contoured in white. Arrows point to discrete areas of darkness within the tumour ROI for Patient A during the first portion of NAC, highlighting a potential treatment-resistant subregion.

