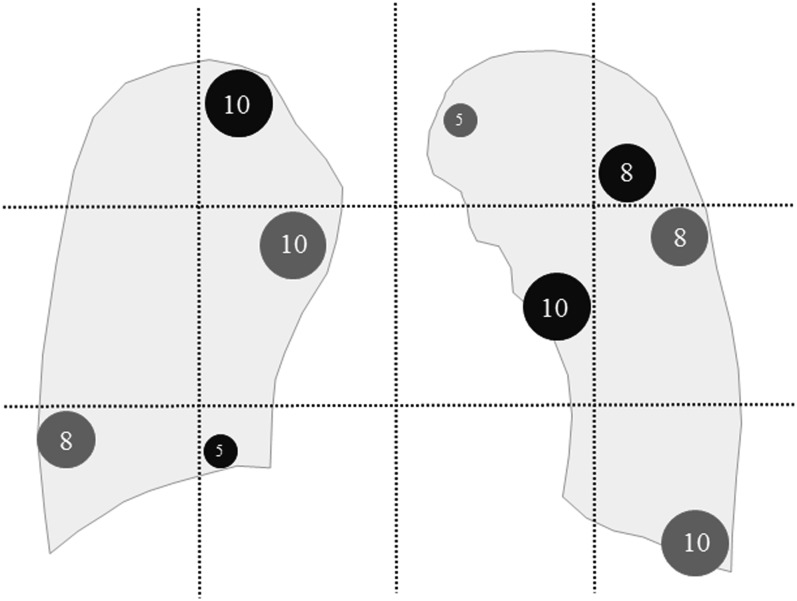
Figure 2.
This is an example scheme of simulated nodules placement in the pre-defined 12 areas; bilateral lung fields were divided into 12 areas by 2 horizontal lines trisecting the craniocaudal distance between the lung apex and the bottom of the diaphragm and 3 vertical lines quadrisecting the distance between the lateral edges of the lung field in the CDT image. Black and dark grey nodules represent less [−800 Hounsfield units (HU)] and more attenuated nodules (−630 HU), respectively. The numbers in the simulated nodules stand for their diameters (mm).

