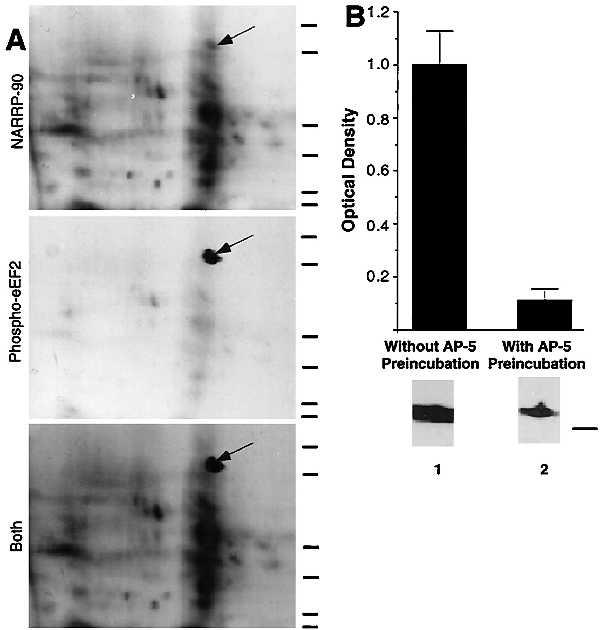
Figure 1.

NARPP-90 and eEF2 comigrate on blots of two-dimensional gels. (A) NARPP-90 phosphorylation was induced in tadpole tecta by NMDA/GLUT stimulation, the labeled proteins were blotted onto nitrocellulose, and NARPP-90 was detected by autoradiography (Top). The same blot was then probed with a phospho-specific anti-eEF2 antibody and the signal was detected with chemiluminescence (Middle). When a film was allowed to expose overnight after chemiluminescent detection, an image was produced that contained both radioactive and chemiluminescent signals (Bottom). This image shows that NARPP-90 and eEF2 have identical molecular masses and isoelectric points. Similar results were obtained in three other experiments. Molecular mass standards from bottom to top for each panel are 7.5, 18.2, 31.5, 42.7, 80, and 135 kDa. (B) Densitometric measurement of immunoblots detecting NMDAR-induced phospho-eEF2. Tecta received NMDA/GLUT stimulation with or without prior preincubation with 60 μM AP5. NMDA/GLUT stimulation alone resulted in a 7-fold increase in phospho-eEF2 compared with AP5 control (n = 5). NMDA/GLUT stimulation without AP5 preincubation produced robust eEF2 phosphorylation (lane 1). However, NMDA/GLUT stimulation after AP5 preincubation resulted in low levels of eEF2 phosphorylation (lane 2). To verify equal amounts of total eEF2 protein, all blots probed with the phospho-specific antibody were subsequently stripped and reprobed with the eEF2 antibody that does not distinguish between phospho- and dephospho-eEF2. The total amount of eEF2 did not vary as a function of stimulation (data not shown). The molecular mass standard for B is 80 kDa.
