
Figure 2.
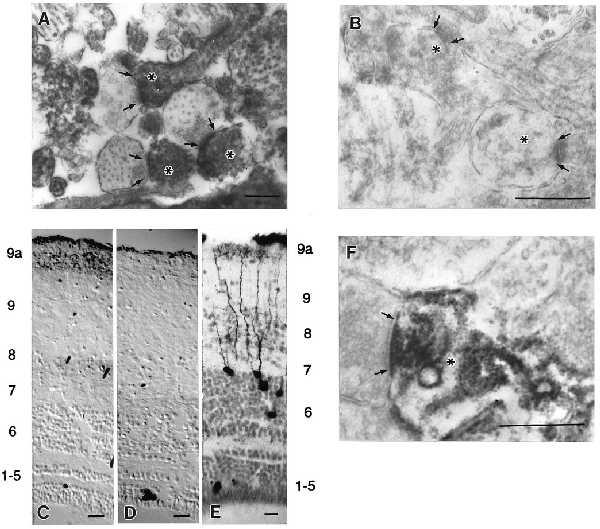
Phospho-eEF2 in tecta detected by immunolocalization. Arrows delineate the presynaptic extent of the synaptic apposition, and asterisks mark dendritic profiles. (A) Electron micrograph of phospho-eEF2 immunostaining in the retinorecipient layers of tadpole tecta induced by NMDA/GLUT stimulation shows localization within dendrites. (B) Electron micrograph of phospho-eEF2 immunostaining induced by NMDA/GLUT stimulation after a 5-min preincubation with AP5 showed little or no phospho-eEF2. (C) Light-level micrograph of phospho-eEF2 immunostaining induced in adult frog tecta by NMDA/GLUT stimulation. (D) Light-level micrograph of phospho-eEF2 immunostaining in adult frog that received AP5 preincubation before NMDA/GLUT stimulation. No neuronal phospho-eEF2 staining was observed. (E) Tectal neurons that receive indirect ipsilateral retinal input via the nucleus isthmus have dense dendritic trees within layer 9a. Note that the layer labels for C and D correspond to the numbering on the left and the layers for E are on the right. (F) Electron micrograph of phospho-eEF2 immunostaining in adult frog tecta induced by NMDA/GLUT stimulation. This stimulation in adult tecta leads to preferential localization of phospho-eEF2 within dendritic segments subjacent to synaptic contacts in layer 9a. Pictures shown are representative of at least five independent determinations. Scale bars for A, B, and F represent 0.5 μm. Scale bars for C–E represent 50 μm.