
Figure 2. Viability of neutrophils in response to kinase inhibitors.
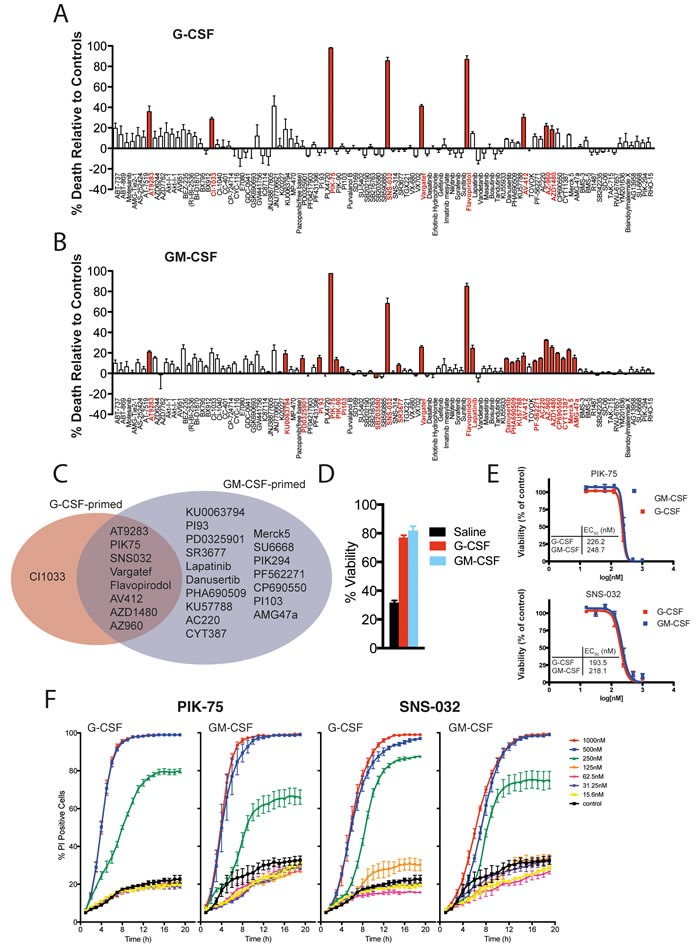
A. & B. Viability analysis from live cell imaging of primary murine bone-marrow neutrophils primed with either G-CSF (A) or GM-CSF (B) in response to a panel of kinase inhibitors [μM] over 24 hours. Bar graphs display percentage viability relative to G-CSF- or GM-CSF-only primed controls at 12 hours. Red bars denote significance, p < 0.05 (corrected by Hommel's modification of a Bonferroni t test). C. Summary of data in A) & B) highlighting the kinase inhibitors that significantly altered neutrophil viability. D. Viability of saline-treated primary murine bone-marrow neutrophils compared to neutrophils primed with GM-CSF or G-CSF for 21 hours. E. EC50 values for PIK-75 and SNS-032 as calculated from kinetic live cell imaging data of murine bone-marrow neutrophils shown in F., concentrations as marked. For all above, data represent mean ± SEM from three independent samples.