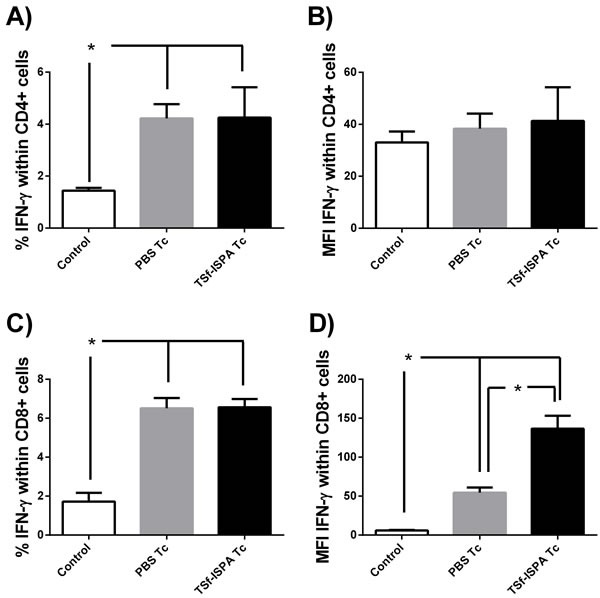
Figure 5. Production of IFN-γ within CD4+ and CD8+ in vitro.

Splenocytes from control non-infected (control), PBS-inoculated and infected mice (PBS Tc) and TSf-ISPA immunized and infected mice (TSf-ISPA Tc) were cultured with T. cruzi homogenate during 40h. PMA and monesin were added to the culture four hours before flow cytometry staining with anti-CD4, anti-CD8 and anti-IFN-γ antibodies. A. Percentage of IFN-γ production within splenic CD4+ T cells B. MFI of IFN-γ within CD4+ cells. C. Percentage of IFN-γ production within splenic CD8+ T cells, D. MFI of IFN-γ within CD8+ cells (n = 4/group). Data shown are representative of two independent experiments, *p < 0.05, Mann-whitney test.
