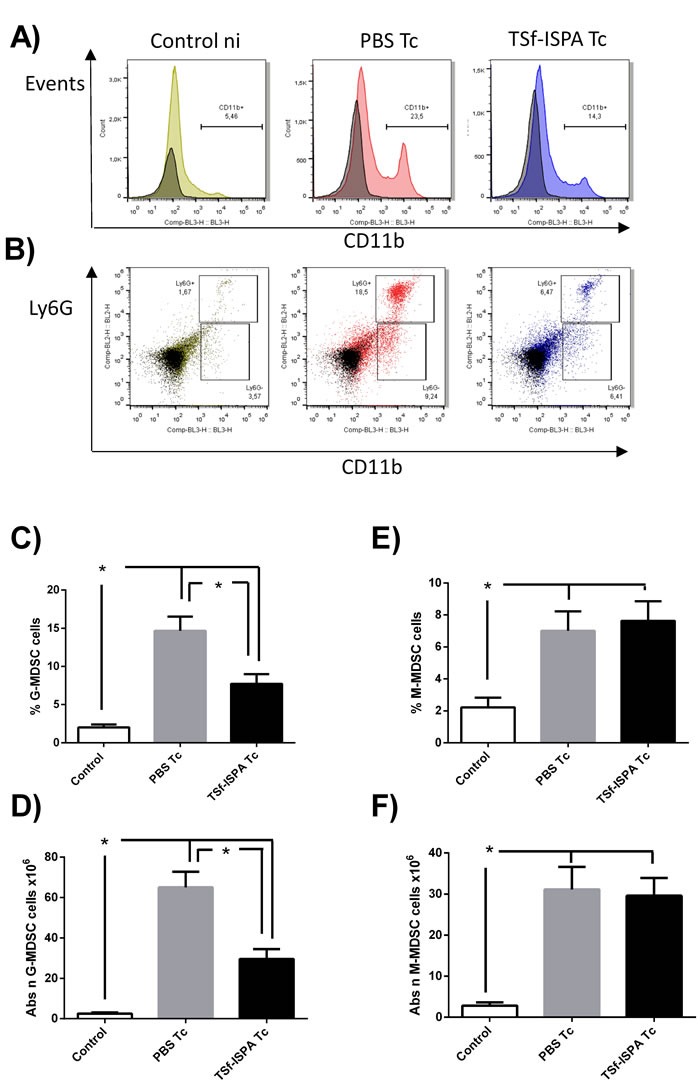
Figure 8. Changes in spleen CD11b+ Ly6G+/- cells at day 21 post T. cruzi infection.

Splenocyte suspensions were prepared and expression of Ly6C-FITC, Ly6G-PE and CD11b-PerCP-Cy5.5 expression was analyzed by flow cytometry in control non-infected mice (control), PBS-inoculated and infected mice (PBS Tc) and TSf-ISPA immunized and infected mice (TSf-ISPA Tc). A. Representative dot plots showing alterations in the percentage of spleen CD11b+ cells among groups. B. Representative dot plots showing alterations in the percentage of CD11b+Ly6G+ (G-MDSC) and CD11b+Ly6G- (M-MDSC) cells among groups. C. Percentage of G-MDSC CD11b+Ly6G+ cells, D. Absolute number of G-MDSC CD11b+Ly6G+ cells (x106). E. Percentage of M-MDSC CD11b+ Ly6G- cells. F. Absolute number of M-MDSC CD11b+Ly6G- cells (x106). Data are expressed as means + standard deviations (n = 4 per group). *, p < 0.05, Mann-whitney test. Data shown are representative of three independent experiments.
