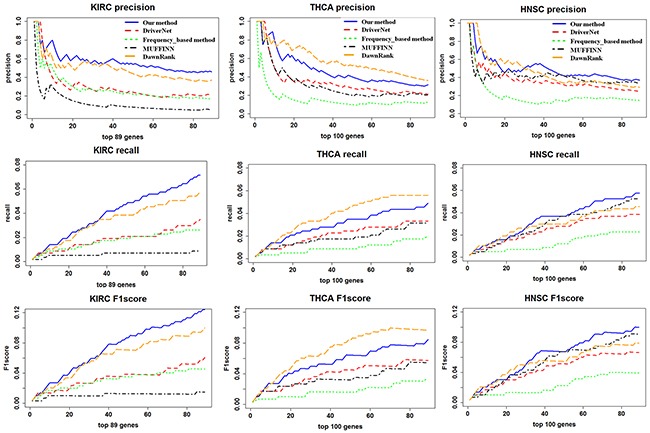
Figure 1. A comparison of the precision, recall, and F1 score for the top ranking genes in our method and DriverNet.

The X-axis represents the number of top ranking genes involved in the precision, recall, and F1 score calculation. The Y-axis represents the score of the given metric.
