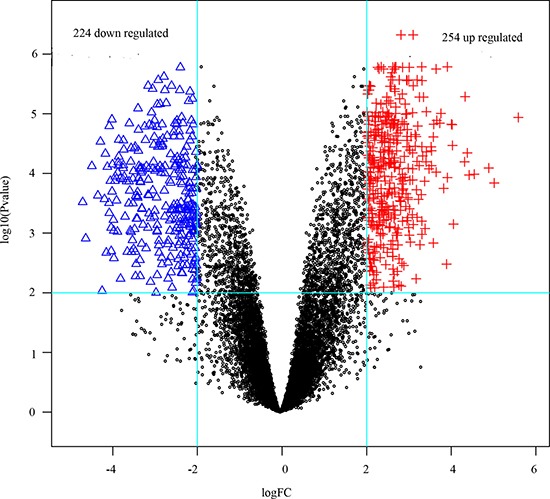
Figure 1. The DEGs in ductal tumor samples compared with those in normal samples.

Blue triangles and red plus signs represented down- and up-regulated genes respectively, black dots were non-differentially expressed genes.

Blue triangles and red plus signs represented down- and up-regulated genes respectively, black dots were non-differentially expressed genes.