
Figure 6. Survival curves of ductal tumor patients associated with VCAN and COL4A1.
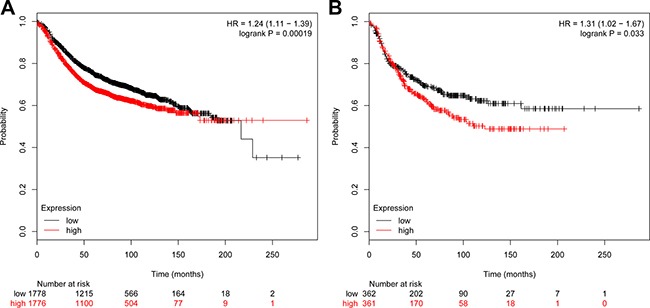
(A) represented the survival curve of COL4A1 and (B) represented the survival curve of VCAN.
Official websites use .gov
A
.gov website belongs to an official
government organization in the United States.
Secure .gov websites use HTTPS
A lock (
) or https:// means you've safely
connected to the .gov website. Share sensitive
information only on official, secure websites.
(A) represented the survival curve of COL4A1 and (B) represented the survival curve of VCAN.