
Figure 2. Clustering analysis of DNA repair genes which significantly influence prognosis.
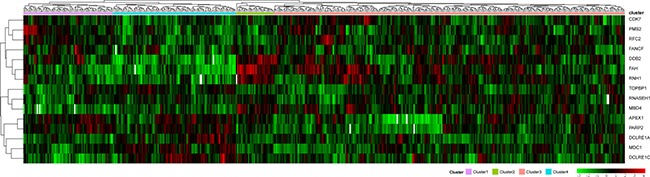
The horizontal axis represents sample, using Euclidean distance to calculate distance; the vertical axis stands for genes, using Pearson correlation coefficient to calculate distance, horizontal axis divides the sample into 4 parts which are cluster 1, cluster 2, cluster 3 and cluster 4. The color in red represents level.