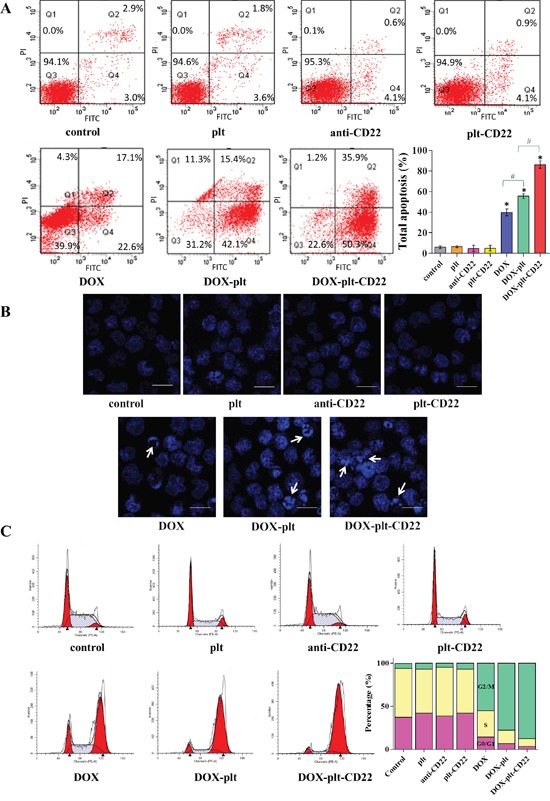
Figure 4. Apoptosis and cell cycle state of Raji cells.

(A) FCM was used to investigate the apoptosis of Raji cells following the different treatments; the bar graph shows the comparative apoptosis levels of Raji cells from different treatment groups. (*P<0.05 when compared with controls, #P<0.05). (B) Fluorescence microscopy images of Raji cells after DAPI staining (scale bar: 10 μm; ×400). Cell apoptosis is indicated by “→”. (C) Cell cycle state of Raji cells analyzed by FCM. The bar graph shows the percentage of cells in G0/G1, S, and G2/M phases under different treatment conditions.
Abbreviations: FCM, flow cytometry; DOX, doxorubicin; plt, platelet.
