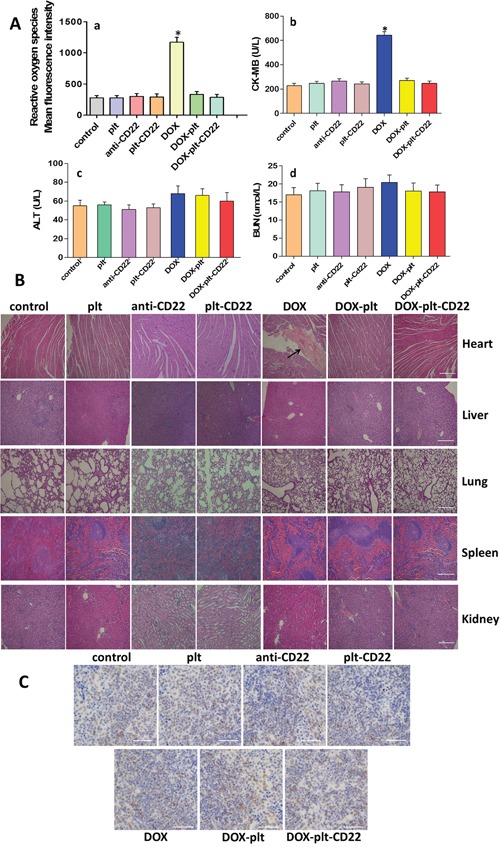
Figure 8. Toxicity in normal tissues obtained from animals in different treatment groups.

(A) a, ROS in myocardial cells was analyzed by FCM; b-d, alanine transaminase (ALT), blood urea nitrogen (BUN), and creatine kinase-MB (CK-MB) were monitored on day 12 after treatment. (*P<0.05 when compared with control). (B) Hematoxylin-eosin staining of heart, liver, lung, spleen and kidney tissues obtained from animals in the different treatment groups (scale bar: 200μm; ×40). The histopathological changes are indicated by “→”. (C) Immunohistochemical staining for B cells in spleens from different groups (scale bar: 100μm; ×100).
Abbreviations: DOX, doxorubicin; plt, platelet; ROS, reactive oxygen species; FCM, flow cytometry.
