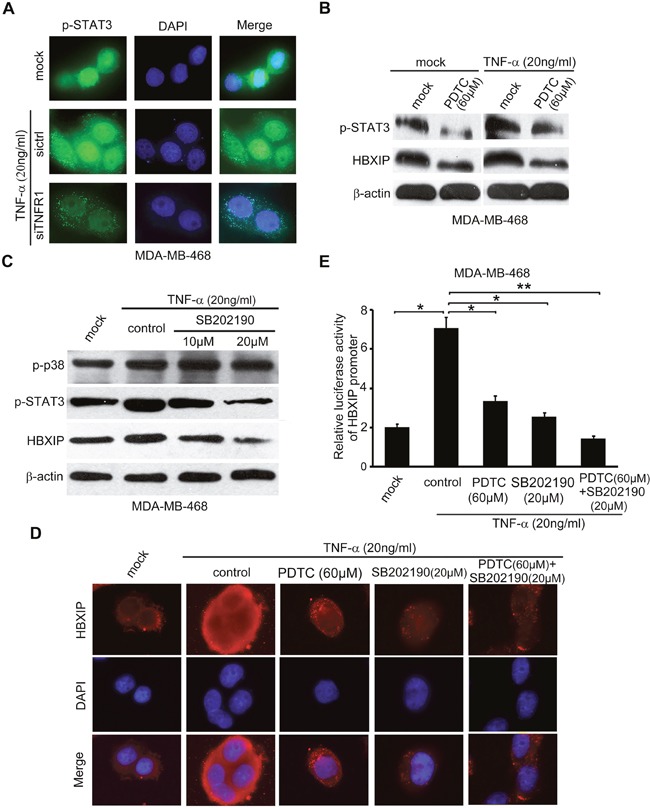
Figure 4. TNF-α enhances STAT3 phosphorylation via NF-κB and/or p38 signaling in activation of HBXIP promoter.

(A) Immunofluorescence and nucleocytoplasmic of p-STAT3 expression analysis were carried out in MDA-MB-468 cells treated with 20 ng/ml TNF-α and transiently transfected with siTNFR1 (200nM). Immunofluorescence images of p-STAT3 (green) were shown. DAPI staining (blue) was included to visualize the nucleus. (B) Western blot assays were applied for detecting the levels of p-STAT3 and HBXIP in MDA-MB-468 cells upon the treatment of 20 ng/ml TNF-α and/or 60 μM PDTC. (C) The levels of p-p38, p-STAT3, HBXIP were detected by Western blot analysis in MDA-MB-468 cells upon the treatment of 20 ng/ml TNF-α, 10 μM and 20 μM SB202190. (D) The immunofluorescence of HBXIP expression analysis was carried out in MDA-MB-468 cells treated with 20 ng/m TNF-α, 60 μM PDTC, 20 μM SB202190 or combimation of PDTC and SB202190. Immunofluorescence images of HBXIP (red) were shown. DAPI staining (blue) was included to visualize the nucleus. (E) The relative activities of HBXIP promoter were detected by dual luciferase reporter gene assays in MDA-MB-468 cells upon the treatment of 20 ng/m TNF-α coupled with 60 μM PDTC, 20 μM SB202190 or combination of PDTC and SB202190. Error bars represent ±s.d., *p < 0.05, **p < 0.01, Student's t test. All experiments were performed at least 3 times.
